I’m using cs6 yeah…
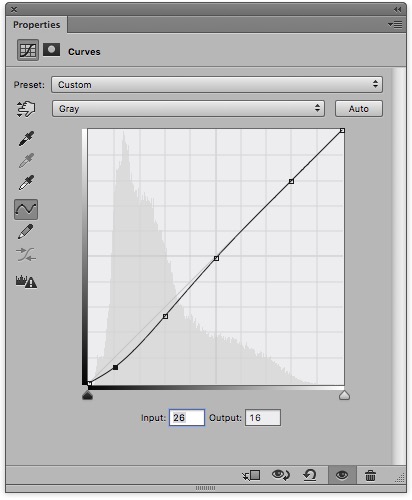
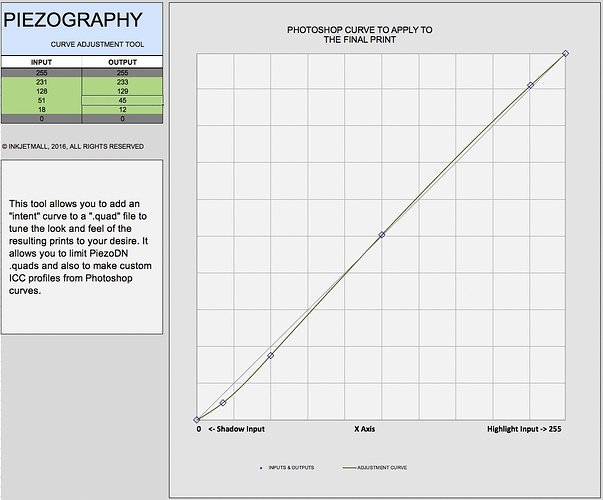
To see a simulation of the curve you are baking into a new quad, simply create a PS Curve layer using the same points as in the Curve Adjustment spreadsheet. You can even save it as a preset to flip on and off. Just be sure you don’t make you negative with it on if using the adjusted quad!
[center]
For soft-proofing, first you need to make an ICC with QTR-Create-ICC-RGB. It is important to use the RGB version of the app if you want to simulate the color of the process. To do this, print a target that was made with your adjusted quad, read it, put that data into the Smoother and create a new CGATS text file, drag the text file to QTR-Create-ICC-RGB, put the icc that is created into your ColorSync folder (or whatever the equivalent of that is in Windows).
To set up soft-proofing in Photoshop: View > Proof Setup > Custom … Device to simulate > [your icc] … Preserve Numbers checked. (The simulate paper and black ink are like an unnaturally heavy layer of fog in my opinion.)
To turn it on and off: View > Proof Colors, or Command-Y.
I am presuming this works the same on Windows as it does on Mac. I could be wrong, but have no way to test it myself.
Using one soft-proof profile to compare against no proof is not going to show you what you are hoping to see. It will look paler and flatter than the non-soft-proofed view. You actually need 2 or more soft-proof iccs to compare to each other – one for the linearized quad and another for each adjusted version that you make and want to compare.
I’m not sure I have this 100% right. I’ve done it before successfully, but I don’t routinely use soft-proofing myself.
Keith
Thanks for this, it’s all really useful information.
I was wondering whether I could view the ICC I created on the Mac as a curve/6 point values though, so I could mimic this in the curve adjustment tool in windows, albeit milder
Cheers
I don’t think you can take an ICC and plot a curve (or set of curves) from it, at least not without some special ICC analysis software that I don’t have. Maybe Walker can comment on that.
However, the curve screenshots above – both my last from Ps, and the previous that both of us posted from Curve Adjustment – show the effect that is being applied to either quad or icc. If you make a Ps curve using the same points, you are seeing the effect that the quad or icc will produce.
Alternatively, you could apply the curve to the image file and print with the linear quad to get the same (or nearly the same) result in a print. The purpose of modifying the quad or using an icc is to avoid having to do this. Whatever you way you choose, do not apply both simultaneously unless you want to multiply the effect!
Ahh ok thanks
Also, just realized I sent you the wrong quad to adjust…
That could be whythe last one I printed was very flat. The first lin was too strong. 3880-PiezoDN-PtPdPlatineMaster-lin-lin.quad (10.3 KB)
Is curve in the screen shot you posted your personal one?
From what I remember you saying before is that you printed your images without adding a curve or ICC.
Will do some reading regarding soft proofing my monitor
Had to make a small change to the name to keep it below 40 characters.
3880-PiezoDN-PtPdPlatineMaster-lin2-adj.quad (8.3 KB)
Thanks once again!..
Just one I did quickly that I think might be what you need. I’m guessing that what you posted above will be too mild, but printing with it and judging by eye is really the only way to tell. It’s very close to the default icc that is created by the PPEv2 icc tool and the app that goes with it. (Not the same as the QTR-Create-ICC default which I think is way too heavy.)
I should have a screenshot of a graph showing the difference between the default results from QTR-Create-ICC and Piezography-ICC-Profiler, but I can’t seem to find it. I have posted it on the forum before somewhere. If I can find the data I will recreate it and post it here later.
I do have a personal adjustment curve that I have used a few times and seems to do what I want. It is a very gentle S-curve.
[center]
[/center]Would be good to try my quad with the PPEv2 ICC curve if you think mine is too mild
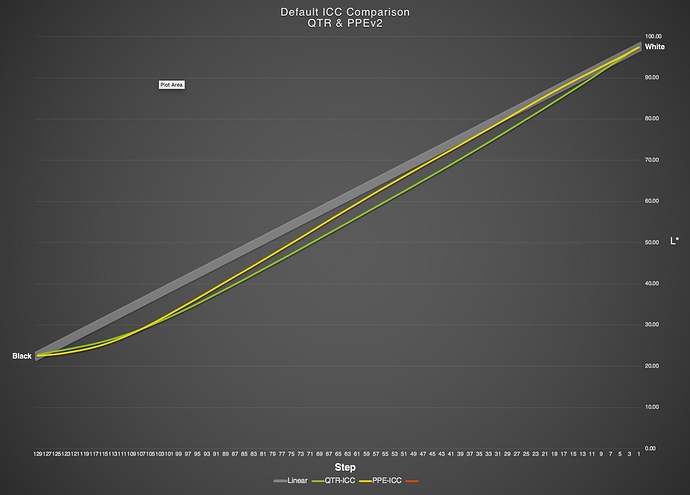
Here is a graph that shows the default “characteristic curves” of ICCs created by QTR-Create-ICC and Piezography-ICC-Profiler. By default I mean what is made directly from the straight CGATS data without any further modification or custom shaping.
[center]
[/center]Funny, from this it looks like the PPE-ICC would increase the highlights more than the QTR-ICC.
Would expect the QTR-ICC to rise above ‘linear’ in the highlights. I’ve noticed a big contrast boost both in upper and lower values with it. It’s effect was welcome in the shadows, albeit too much. However, I didn’t like that it made the highlights brighter.
Neither of these shows a boost in highlights. I have been going by the assumption that you are using Windows and therefore QTRgui which has no means of using ICCs. I thought you have mentioned that several times. Am I mistaken? Are you printing from a Mac?
I have both a PC and a Mac mini.
When printing with ICCs it was from the Mac, as you said you can’t use them on Windows.
i found that the ICC for the Mac would increase the density of my highlights, which is strange as you say neither of these curves shows a boost in highlights. 
The mini should be a perfect printing platform especially if it can run at least up to 10.13. (I had a 2006 mini for my scanner.) All this platform back and forth is so tedious since I can’t test anything Windows on my end.
A few years ago I made a series of ICCs using QTR-Create-ICC for several papers, and the results of each and every one of them were as in the graph I just posted. In fact, I soon realized that it wasn’t even necessary to make individual linearizations for each paper if I was going to make and use an ICC for each. I single “Master Linearization” was close enough for most papers that each ICC made from it was almost perfectly identical to the others. I thought of it as the great equalizer. Unfortunately, I didn’t really like the excessive darkening of the shadows. I did realize that I could custom shape the ICCs as well, but by that point I was deep into printing a project using a single paper and it just didn’t matter. I did use a tweak similar to the adjustment curve I posted above when making the final quad.
I have never seen a default ICC raise the highlight values at all so I have to wonder if you may have been unintentionally introducing some other influence, or maybe using it with a different quad that the one it was made from.
I always assumed that the QTR ICC was an S shaped curve. Will have to look at how I created the ICC. Could’ve gone wrong somewhere. It’s definitely laying down more ink in the highlights. Can be seen in both the neg and print.
I think you’re right that I should stick to one platform (that being Mac). I just need to make it more comfortable to work on by getting more memory and a keyboard for it.
Are you saying you didn’t like the excessive darkening of the QTR-ICC?
Have you tried printing with the PPE-ICC?
Would really appreciate if you could add the milder PPE-ICC as a curve adjustment to my Lin2 quad so I could try it out.
Yes, the QTR_ICC is too dark for my taste. The PPE-ICC is better. I fine tuned it a bit more with an adjustment curve in PPEv2. I’ll make a screenshot to show you what that looks like tomorrow. I’m done for tonight.
Here’s the PPE_ICC from your lin2.quad:
3880-PiezoDN-PtPdPlatine-lin2-Piezo.icc.zip (97.1 KB)
I can’t do this directly to the quad without making a curve adjustment that mimics the ICC shape. I’m too tired tonight so I’ll do that tomorrow too – the screenshot will show what it looks like in PPEv2.
No prob, thanks
Was hoping you could add an adjustment curve that mimics the PPE-ICC to make an adjusted quad for Windows.
No matter, do i just print my lin2 curve alongside this ICC in print tool?
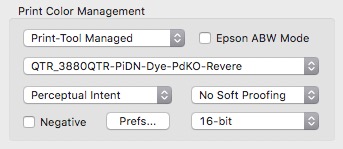
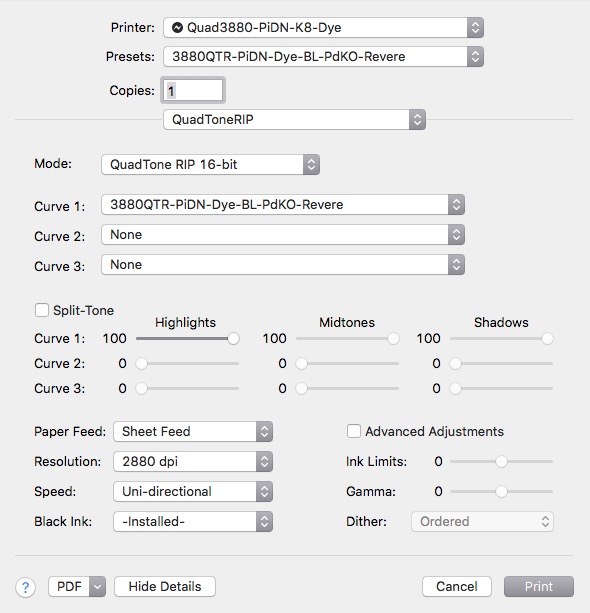
If using a Mac, the setup for printing with an ICC is:
-
Print-Tool Color Management
-
QTR Setup
Note the ICC selected in P-T and the curve selected in QTR. They are intimately related in that the ICC was created from this curve along with the readings from a print made with this curve. The only way this works properly is if they are used together.
The specific names are from one of my setups. Yours will be different.
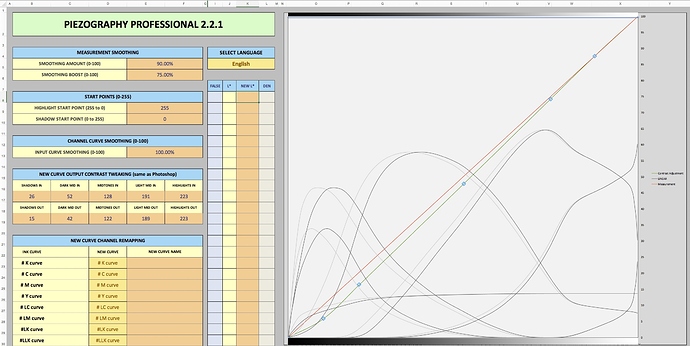
Here is the adjusted quad curve made with and adjustment curve that mimics the default PPE-ICC and a screenshot showing the setup in PPEv2. Note that I took the word Master out of the file name to keep it within the 40 character limit. I also applied some input curve smoothing since yours original curve was a bit wavy. (This is something that PPEv2 graphing displays that original PiezoDN tools does not.)
3880-PiezoDN-PtPdPlatine-lin2-adj1.quad (10.3 KB)
