This is a long and detailed message…sorry for that. But read on for what I think are some interesting observations.
My environment:
QTRGui on Windows 10
7900 printer, Piezography Pro Ink (setup for K5 Cool and K4 Warm)
i1Profiler and i1Pro2 device
I’ve been doing some quad calibration/linearization on my favorite Canson Rag Photographique paper with the updated PPEv2 Tool and the 256-step i1Profiler/i1Pro2 target. I had previously used PPEv1 using the two-iteration 51/129-step targets, but was interested in comparing linearization results using the new PPE tool and the higher number of patches.
Using the 7900 K5 “x900-Canson-RagPhoto-Cool” curve from the Community Edition as my starting Cool curve (remapped for my setup), I printed the 256-step target, hair-dried it for about 20 seconds, then waited for about 48 hours before doing any measurements.
Here’s the data from the first measurement:
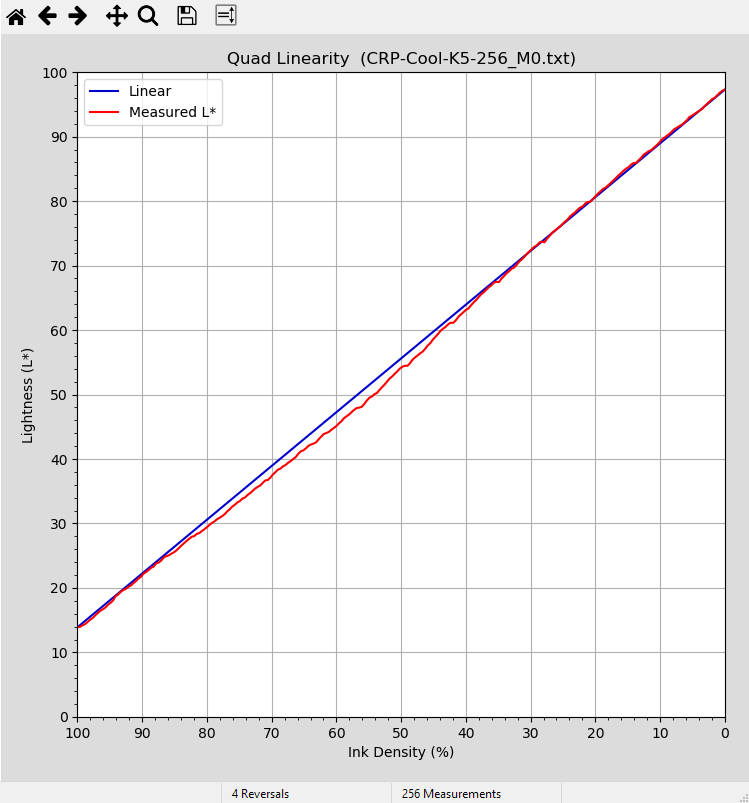
Not too shabby, but there were four reversals in the data. After I removed the linear reference line in the graph to examine the data more closely, I discovered something interesting:
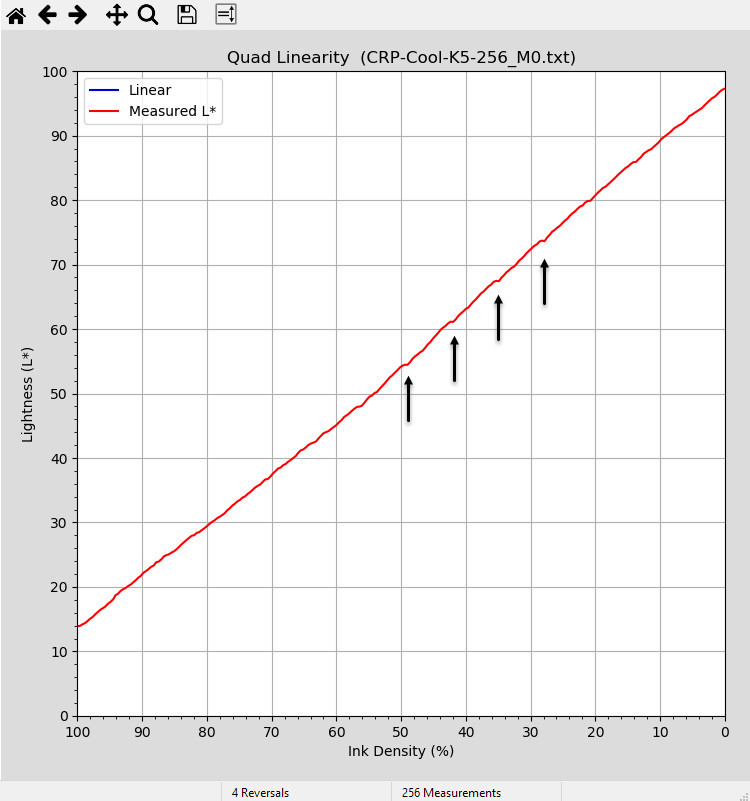
There is a very noticeable “ripple” in the data, and these ripple points correspond to the reversals in the L* values. Even more intriguing, these ripples occur at evenly spaced intervals of 18 data points. While I fully understand that smoothing can address it, this pattern raised some concern for me and I started on a series of tests to identify the source of the ripples.
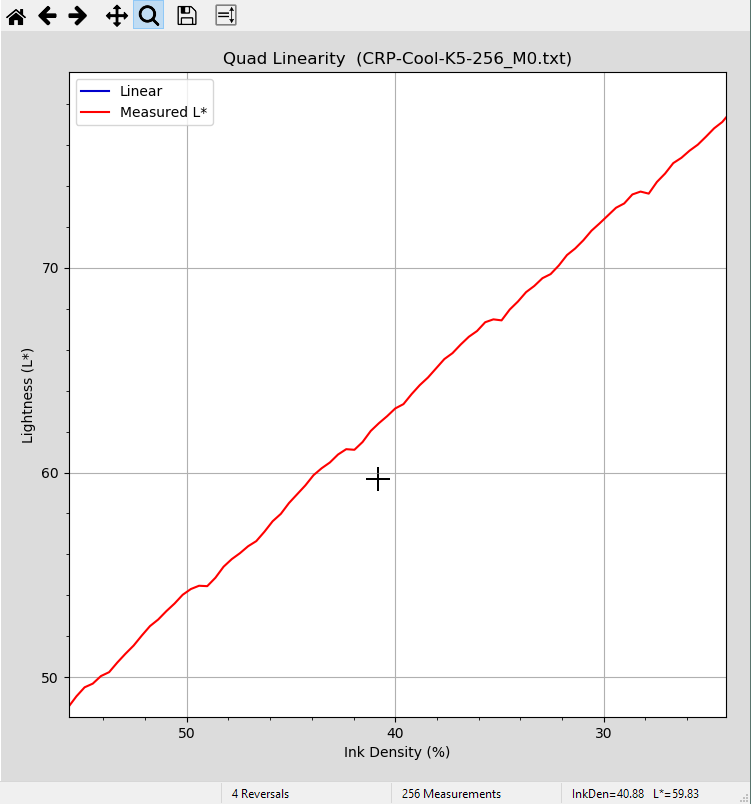
Here’s a zoomed in look at the above four reversals:
My immediate reaction was that something was up with my i1Pro2 device, or possibly my technique for taking the measurements. I made many additional target prints and experimented with different procedures for taking the measurements, but the bottom line is that I’m now comfortable that the problem is NOT with the measurement device or my technique. I even tested with an old i1Pro (Version 1) using the appropriate target and got the same results. These ripples appeared (sometimes more or less pronounced) in all cases while trying to determine if the measurement side of things was the potential culprit.
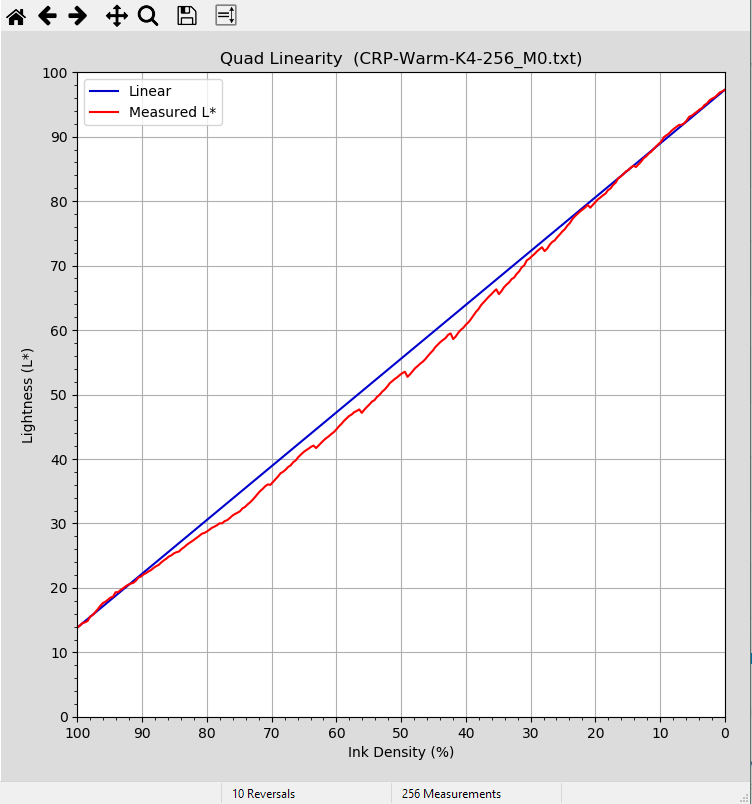
Here’s a particularly worrisome measurement showing severe rippling (the vast majority of my tests were not this bad, but this really illustrates the regular pattern):
At this point I’m thinking the printer or even QTR may be the culprit. The fact that the ripple occurs every 18 data points finally drove me to study the target in further detail and a light turned on:
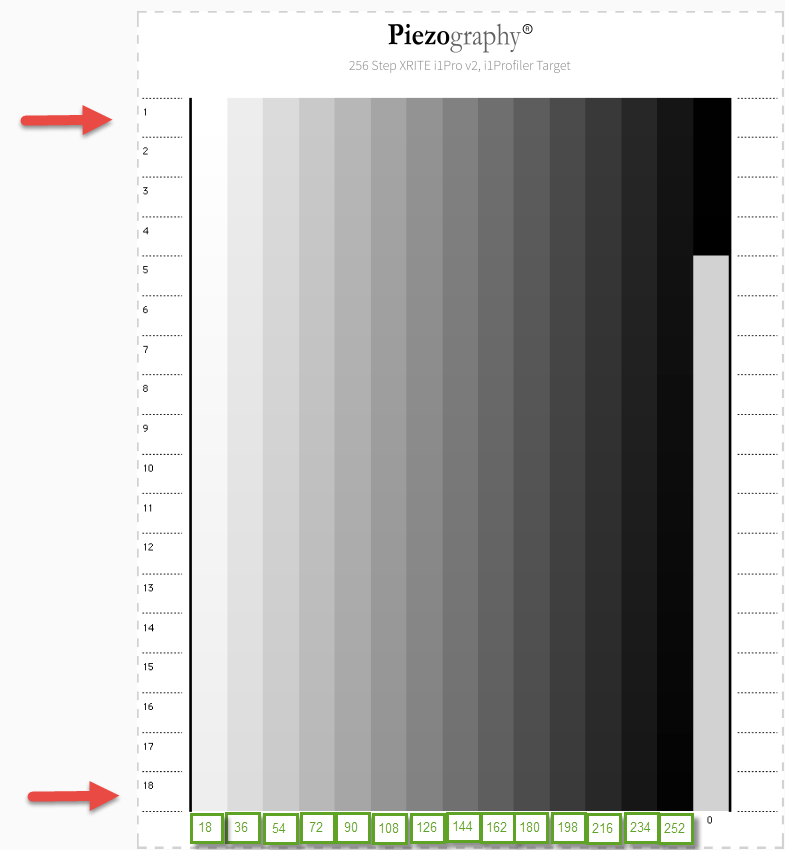
The 256-step target has 18 rows. When I look at the actual L* measurement data, what I’m seeing is that the transition from a data point on Row 18 to the next data point on Row 1 is where the reversals are occuring!
It seems that either a) Row 1 is being printed lighter than expected, or b) Row 18 is being printed darker than expected (or even both). In fact, if you examine the previous screen shot showing the severe ripple, you’ll notice a downward slope between some of the ripple points, which suggests that each row is in fact getting slightly darker than expected as the data is being printed (or measured) down the page.
Here is what I typically see in the data when a reversal occurs:
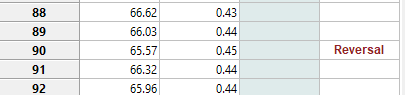
The columns in the above screenshot are:
Measurement ID (1-256) | L* Measurement | Visual Density | Modified L* | Reversals
We see that ID 88 (Row 16) is fine, ID 89 (Row 17) is fine, ID 90 (Row 18) is fine, but ID 91 (Row 1) has reversed and has a higher L* value than the previous measurement.
To further investigate with a focus now on the printer , I printed the 256-step target as a Landscape target (which gets reformatted by i1Profiler to have 13 Rows) and I found the same behavior, but this time the ripple and reversals were spaced at 13 data point intervals. This to me seems like pretty clear evidence that something weird is happening when the patches are being printed. (Note: Reformatting the Piezography target like this should NOT be done normally since i1Profiler will output the new TIF in 8-bit, not 16-bit. But for my experimenting to find the cause of the ripple this was OK).
I have now more-or-less concluded that the printer is the source of the ripple, but I don’t yet have a definitive answer on exactly what mechanism is at work. Is it:
- The print head is heating up as it prints each pass and puts down progressively more ink for a given print value ?, or
- Dithering or dot-placement used by the printer or QTR is not consistent from top to bottom of a printed image ?, or
- ??
To look into the dithering question, I printed a target using QTR at 1440 (instead of 2880) on the Canson Rag Photographique and got this:
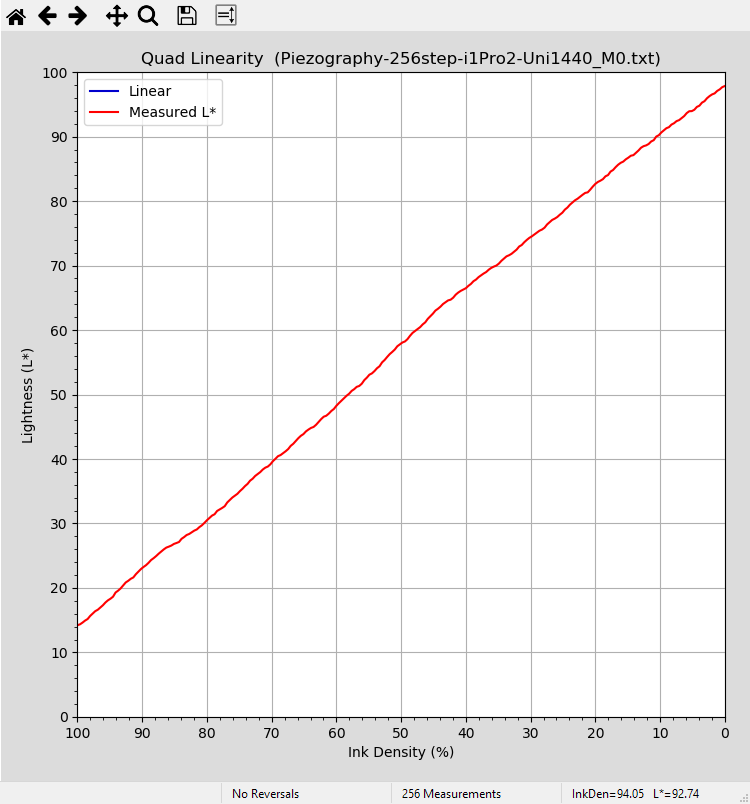
No Reversals! And practically no evidence of any ripple. What IS different here is the overall shape of the curve compared to the 2880 targets (it’s lighter in the quarter tones). More testing would be needed to validate this, but it suggests there is some connection between printer resolution and the ripple behavior. I think the general recommendation is to always print Piezography at 2880, regardless of paper type (matte vs. photo) but these results make me wonder if 1440 might be better for matte media (at least in regards to the ripple issue).
So what is really happening on the printer, at 2880 resolution, that is behind the observed behavior? I’d sure like to know, especially if there is something I can do to eliminate it (other than smoothing of the measurement data).
Dave
P.S. One lesson learned throughout this little exercise: More patches (and more data points) means more measurement resolution. It can reveal things you never knew were there all along!