(Sorry for the long message…this required some details)
Background:
A while back, I discovered that my 7900 was especially prone to what I would call “ink density non-linearity” which was readily apparent in the data “ripple” I noticed when measuring the printed IJM 256 step i1Pro2 target. The basic problem seems to be that as the target is printed, the ink density on the paper for any given gray value increases due to some factor in the mechanics of printing, e.g. ink sloshing in the damper, piezo head heating up, etc. (the old thread where I described this in detail is here).
Current situation:
After some additional testing to determine the exact cause for this, I’ve discovered that the best way to address it and get cleaner target measurements is to do two things:
- Use smaller target patches. This reduces amount of aggregate head motion and therefore reduces the amount of drift when printing the full target.
- Scramble the patches.
I use an i1Pro2 with i1Profiler which is designed for a default patch size of 8mm x 8mm, smaller than the patches on the existing IJM Piezography 256 Step target for the i1Pro2 (those patches are 10mm x 11mm, probably sized originally for a different measurement device).
So I’ve created my own 256 step 16-bit grayscale untagged 720ppi target with the smaller patches and randomized patch sequence. It effectively solves my “ripple” problem. The only downside in using my target is that since i1Profiler outputs the CGATS data samples in row/column order, I have to reorder the data (by referencing the PatchIDs I’ve put in the i1Profiler patch set “PXF” file) before copying that data into the PPE tool for linearization. But this is easily done using a script for the data manipulation.
Now my questions:
IJM has always described the provided targets as “gamma 2.2 hard-coded”. I’ve never fully understood that, but my assumption is that IJM determined that QTRGui and Print-Tool are somehow not printing in linear fashion even when printing an untagged grayscale file with No Color Management, and this meant that to optimize for Piezography the targets should not be linear. (Is this a reasonably accurate understanding?)
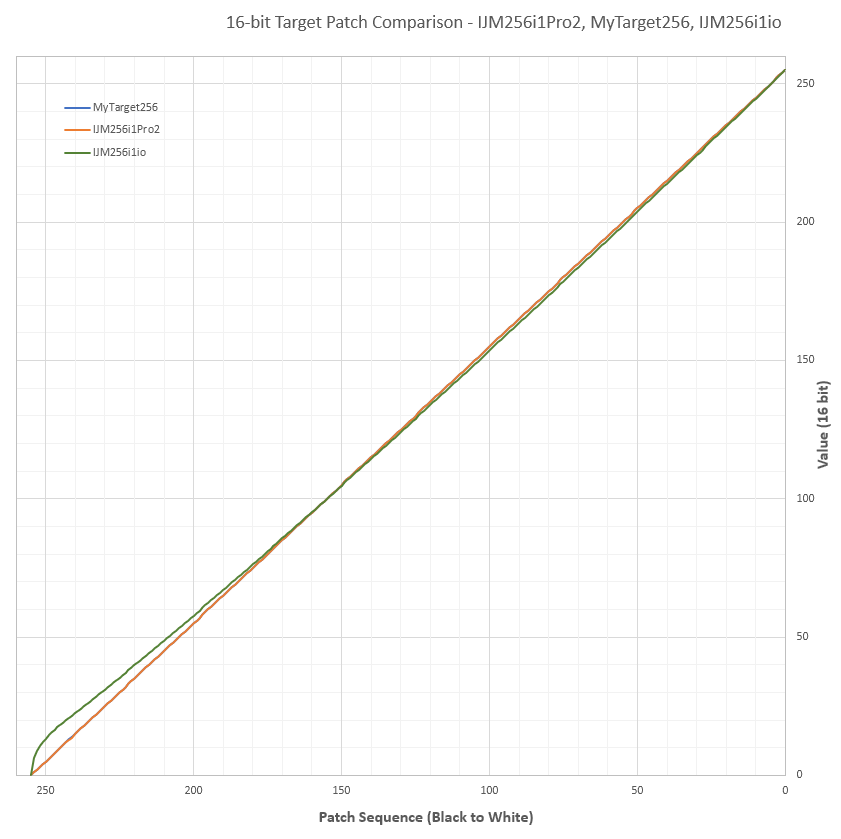
Ultimately I need to make sure my custom target (as described above) will work properly within Piezography design and assumptions. To compare the IJM target with my target, I wrote a Python script that interfaces with the Photoshop DOM scripting interface. It measures each of the 256 individual 16-bit patch values with a ColorSampler placed in the exact center of each patch and reports the values. These values are copied into an Excel spreadsheet where the two targets are compared. Except for 7 non-contiguous patches near black (steps 243, 242, 241, 238, 234, 233 and 230), everything is numerically identical. Here is a graph showing the compared values:
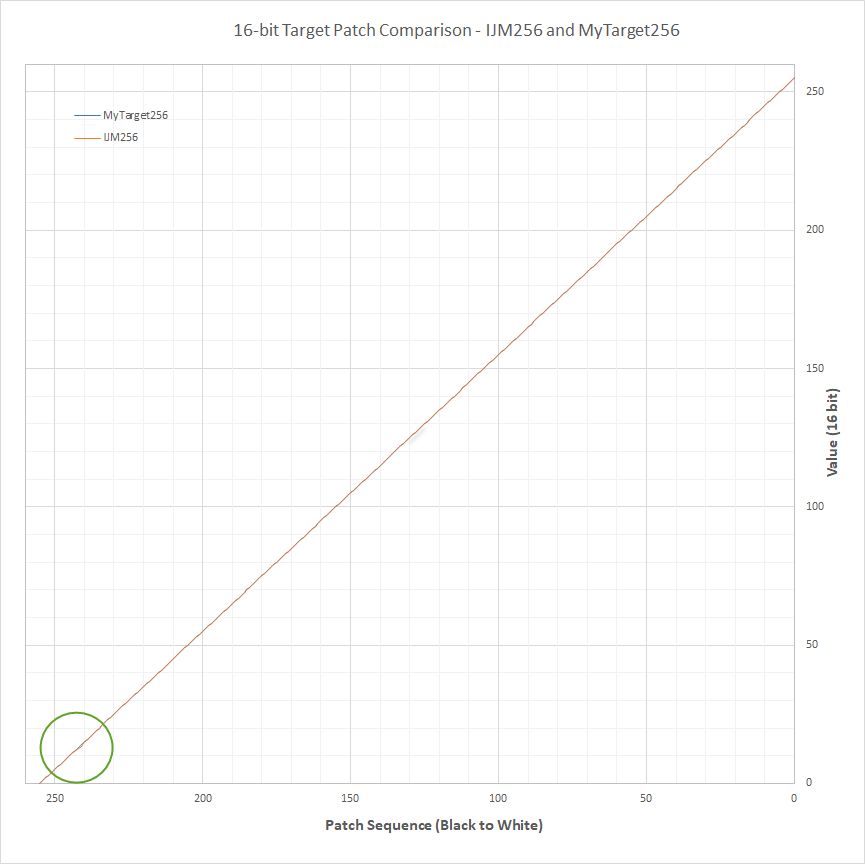
MyTarget is the blue line, the IJM target is the orange line. As you can see, except for a very small blip near black where the differing 7 patches occur, the two lines overlap exactly. The difference in each of those 7 patches is EXTREMELY small, e.g. for step 230 the IJM 16-bit value is 3211, MyTarget value is 3215. That is a difference of .01% ! I looked at those 7 patches in some detail on the IJM target and I can’t really say why they would be different; maybe there is some residual weirdness in pixel values leftover from previous processing. I did spend a lot of time verifying that all patches in my target have uniform pixel values across the full size of each patch.
Since both targets appear to be identical from a linearity/gamma perspective, I believe it should be fine for linearization purposes.
Am I missing anything here in this approach? I want to ensure my target is “Piezography” compatible.
Thanks for reading to the end ![]()
Dave
EDIT: Improved some wording for better clarity.