I just finished my second linearization, starting over from the beginning and carefully controlling “darkroom variables.” For example, I allowed (a) target negatives to cure for 24h before printing them and (b) prints to rest for 24h before measuring them.
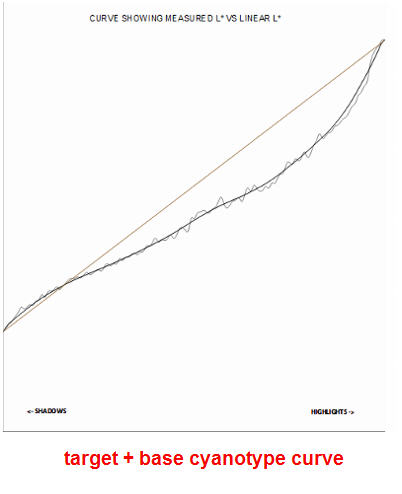
Attachment 1: The Smoother plot of L-values for the target made with the base cyanotype curve
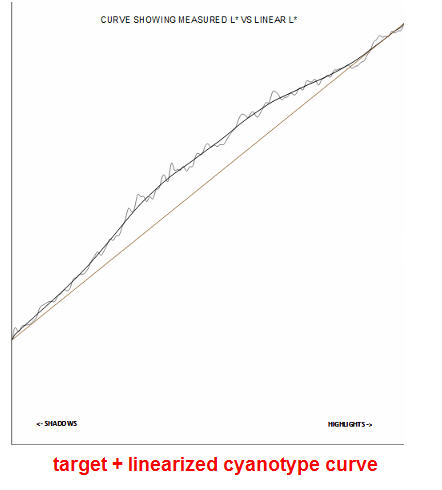
Attachment 2: The Smoother plot of L-values for the target made with the linearized cyanotype curve
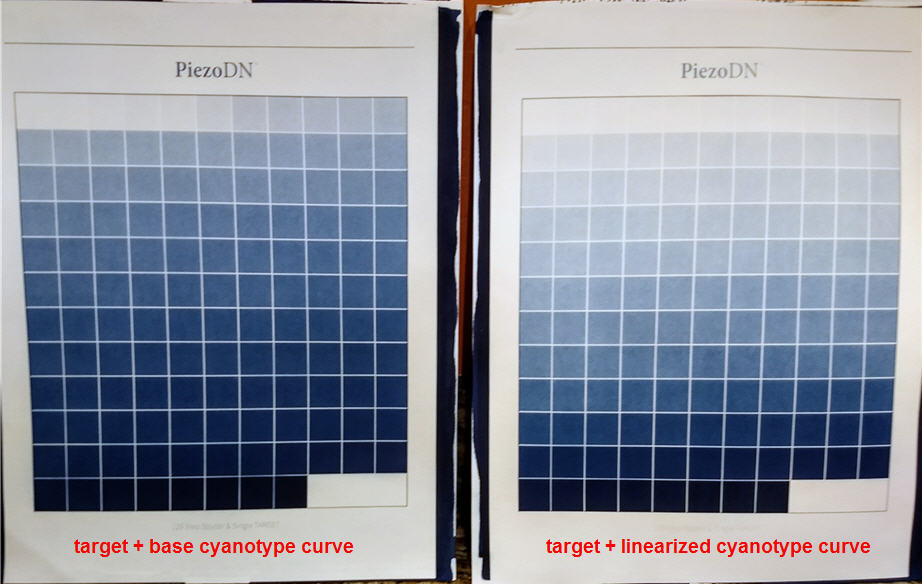
Attachment 3: Photo of the two targets side-by-side
Attachment 1 agrees with my observation that the left target in attachment 3 looks too dark overall.
Attachment 2 agrees with my observation that the right target in attachment 3 looks a bit too light in the midtones, while the highlights and shadows are fairly linear. The highlights look particularly well-separated. I could probably live with this curve.
The linearized curve corrects for the too-dark tones in the base curve target, but it over-corrects. If I make a -lin-lin curve from the linearized target, do you think it will get me closer to a straight line? Or will it overshoot in the other direction? In other words, is the linearization process converging, or will it iterate forever? Are “darkroom variables” such a big a factor for cyanotype that trying to get perfect linearization is futile?
John, first you should know you are presenting good quality documentation which is so helpful. Walker is correct, you need at least one more iteration to create your personal customized curve. I was wondering if you had the Spyder Print tool, glad you invested in it.
If it were me and the next iterative .quad does the trick, I would go the extra step and create an ICC curve, too. That way you should have an easy solution to bring richer blues into those prints that need those deeper hues to produce a stronger aesthetic print. A technically accurate linear print is essential to controlling your process, but the aesthetic of the print itself is the true objective. A good ICC might save you from going all the way back to the digital file.
Best,
Don
OK, then I’ll do it! Unfortunately, by the time I get a linear curve I’ll need to mix up a new batch of Cyanotype, which will probably change everything.
I was planning create an ICC once the iterations converge. Since I’m on Windows, however, and cannot use Print-Tool, I will need to softproof in Photoshop “preserve numbers” checked. Since I customarily softproof in LR, I’m not sure how easy or useful this will be, but I’m eager to find out.
Any idea why the master printed so differently this time than the one you posted on 5/8? Same master.quad? Same darkroom procedure? Paper? etc?
In the earlier pair the midpoint looked good but hilites and lolites were too contrasty. The -lin resulted in it being too dark overall. This is almost the reverse.
In the first pair that you posted, the master was similar to this one, but the -lin didn’t change much.
I agree with Don and Walker to try one more -lin iteration.
One other thing to consider that I’ve written about somewhere, but maybe not in this thread. Because of the inherent variation in hand-coated processes, the best (but most tedious) practice is probably to make 3 (or more) prints of each target round and average the results, then use that average to make the linearization. Do the same thing with the linearized target to see if another iteration is necessary. I’ve only done this when the first print seemed off, and it did prove useful, but it’s a lot more time consuming, not to mention materials.
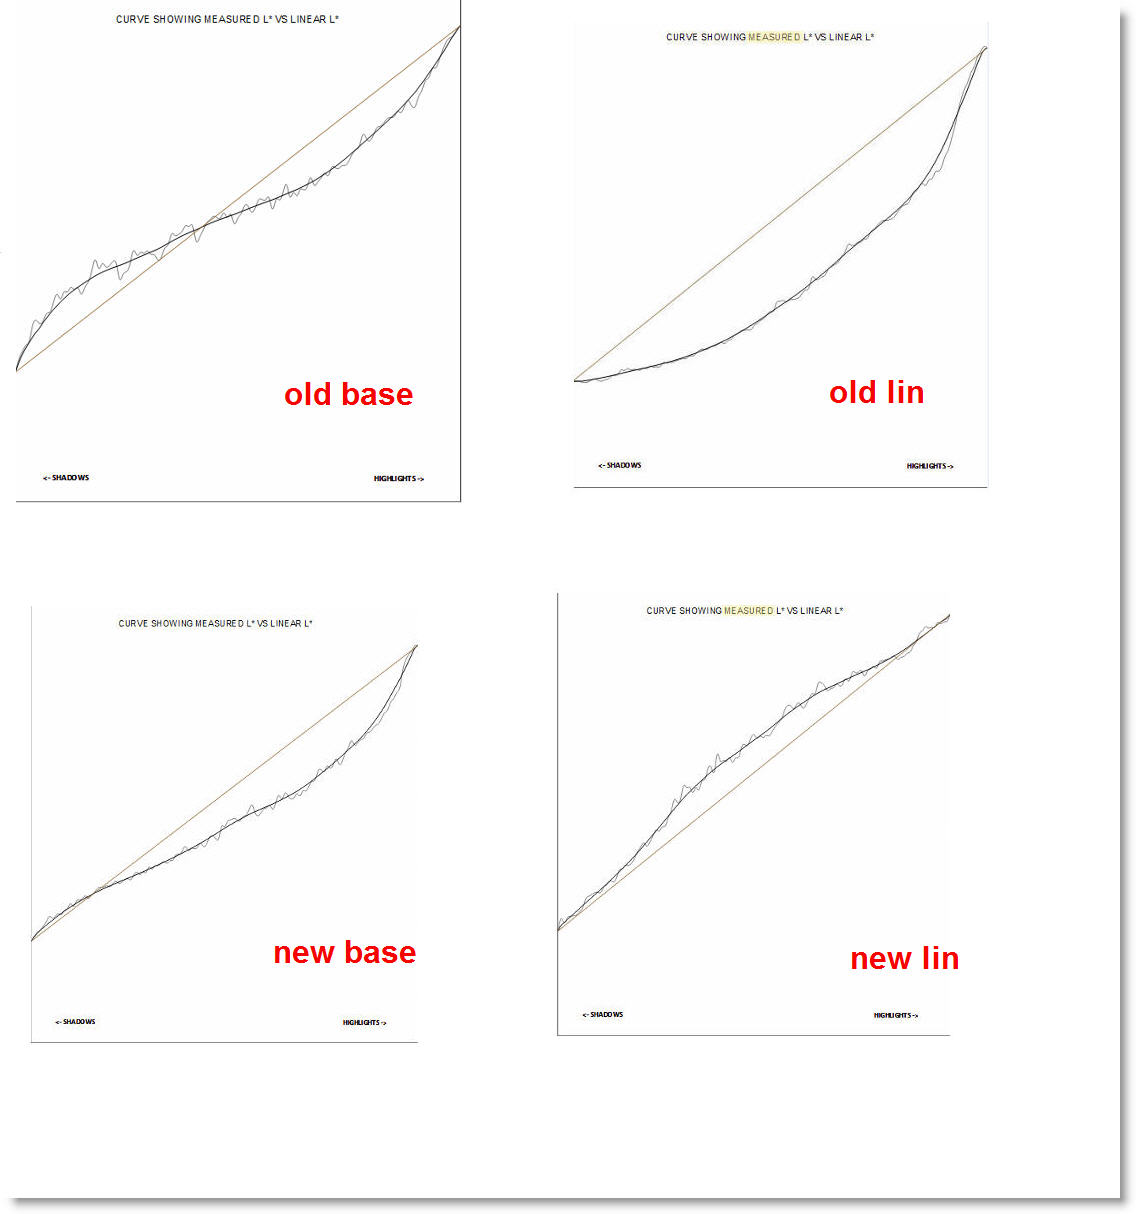
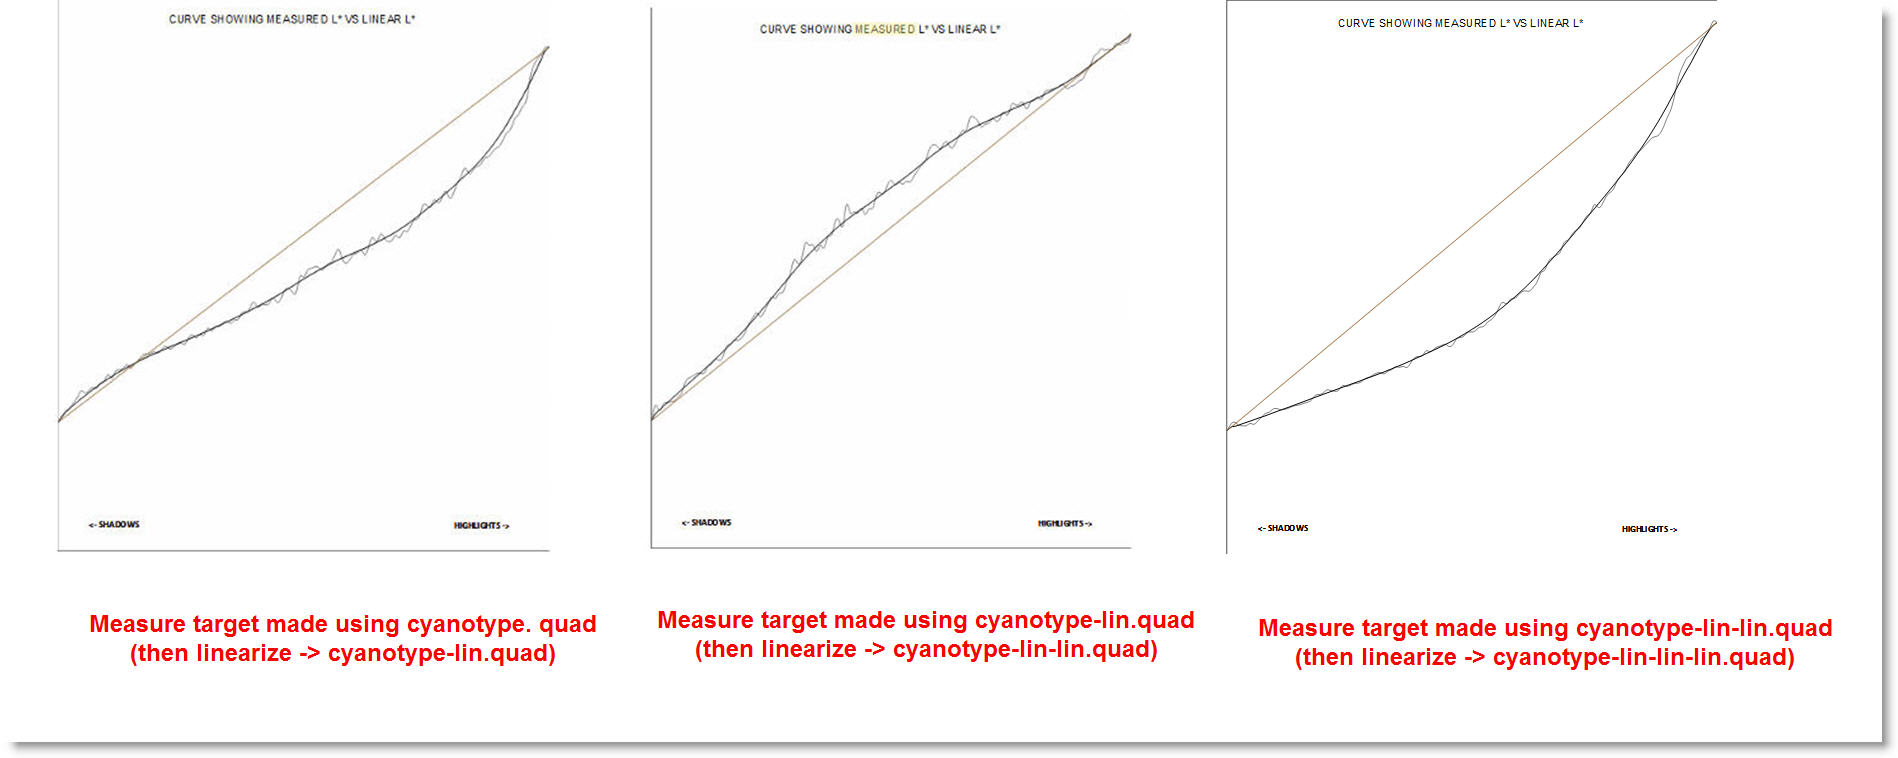
Attachment 1 has screenshots of all four Spyder measurement curves so we can talk about them without scrolling through posts scattered throughout this discussion.
As you can see, the old and the new base targets are not that different. The new base is darker than the old base possibly because I let it sit longer (allowing it to darken) before measuring it.
But as you can see, the linearized targets are wildly different. The old linearized target is WAY too dark and makes no sense when you look at the old base curve which it is trying to linearize. However the new linearized target looks like it is truly attempting to linearize the new base curve by lightening it.
So I have more confidence in the new linearization because it seems to be moving in the right direction!
Things were done the same except for the following:
(1) this time I allowed negatives to sit for at least 24h before printing them
(2) this time I moved my paper supply to a dry location
(3) this time I allowed paper to dry for 2 hours in a dry location after sensitizing
(4) this time I allowed prints to dry for at least 24h before measuring them.
I wonder if any of these differences could account for the problems in the first linearization. E.g., exposing paper that had not dried long enough.
The new final (lower right from the screenshot) linearized curve looks like you are on the right track for your darkroom conditions. Generally speaking that mid-tone bump up (lighter) in the measurements can be attributed simply to your wash time or an other number of small darkroom/procedure condition changes. As others have said in this thread, I suggest printing a few different targets (from the same neg) and processing them. Then measure all of these and average the measurements together. Most likely you will come up with a pretty linear result and if it isn’t linear you can always do a final final -lin.quad from these averaged targets. This final final -lin.quad is taking into account your general darkroom variability.
best regards,
Walker
all the best,
Walker
Great idea. I made a -lin-lin target negative yesterday. I will make three prints from today, then average the readings to get a -lin-lin-lin.quad.
I never realized Cyanotype was so sensitive to darkroom variables. I am using New Cyanotype; perhaps it is more sensitive.
Is there any use for the GCATS-out.txt file created by QTR-Linearize-Quad?
John, I am not certain there is much of a shelf life to potassium ferric cyanide. This compound is highly biodegradable, which is why it is one of the very first chemical compounds to be internationally regulated. FYI biodegradable speaks to a compound’s ability to return to its component parts.
The easy equation: it quickly becomes: potassium - mineral supplement, iron - needed by mammals and, oh yes, pure cyanide - toxic in trace amounts (parts per billion). Its use is banned worldwide from all restricted waterways and most riparian systems. OK, so the last part was political. The point for you is that once it is in solution it may not last all that long. Dry it will store a long time, but wet I would be suspect of any long inferred shelf life.
Don
Mike Ware claims a 1-year shelf life. I have been making 100 ml batches and using them up in three months on average (100 ml makes fifty 9 x 11 prints). As I go larger, I’ll be using it up faster. I’ll make my next batch 250 ml.
The change in color of the solution, as I get near the bottom of the bottle, concerns me, but I cannot say that there is any perceptible difference in the prints. Of course now that I am working on linearization, every small variable needs to be considered.
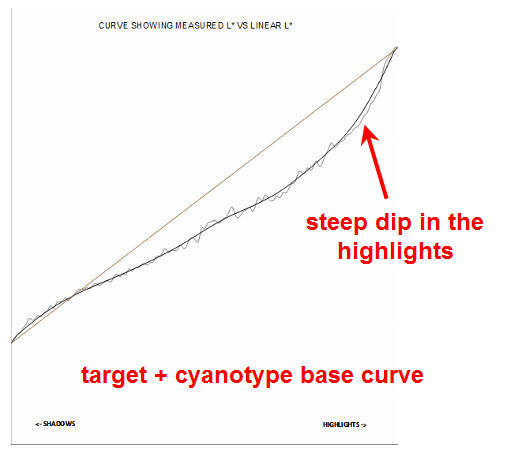
This is very interesting! I did another iteration. This time, I followed Walker’s suggestion and made three targets, measured them, and took average L-values into the Smoother. This was pretty much an academic exercise because I could see right away that the L-values values were actually DIVERGING FROM rather than converging to a straight line (see attachment 1). This is consistent with what I observed in my two previous attempts at linearization. We chalked it up to environmental factors, but I always suspected something else was going on (read on).
Here’s something Keith Schreiber said elsewhere: Classic Cyanotype (CC) has a short exposure scale whereas New Cyanotype (NC) has a much longer exposure scale.
Since I am using NC, and since the master cyanotype quad was undoubtedly made for CC, then I probably should have gone through the limiting process to create a custom master curve for NC. I had read about limiting in the Piezography Manual but didn’t think it applied to me. Now I think it does.
That steep dip in the highlights coming down from the top right is due to the Master being limited for a short scale process. There’s just not enough ink density there for a process that is approximately 2 stops longer in exposure scale. And my guess is that the flip-flops back and forth over the line are because it’s too much for the linearization process to handle.
Print the Limiter file using the Master quad, which will be closer to what you need than this one is. I expect it will print rather light and may even block up a bit in the highlights. The opposite of what this is doing. But that’s where you need to start to make a proper custom limited quad for the process. I did this, but for the 1430, and don’t think it can be easily translated for your printer.
I will do it! Thanks, Keith.
I decided to review the Piezography Manual (p. 107 ff) before getting started. The manual equates “wildly different process” with too much ink. It never mentions not enough ink.
For example, the 4th paragraph on p. 108 says “If your darkroom process process is wildly different and requires a much thinner negative than the normal pre-calibrated curves that come with PiezoDN, you will need to make a new limited .quad.”
The steps of the limiting process (p. 108-109) are clearly aimed at decreasing the amount of ink used in the highlights.
You say the master (cyanotype) quad is already limited. Are you suggesting that some variation of the limiting process (different from the one on p. 108-109) can be used to raise that limit?