Don,
I admit I have been casual about water. The New Cyanotype instructions say to clear by gently washing in water for 20 minutes, but I read somewhere that the water should be pH neutral or slightly acidic. Our water has a pH of 8.0. So I agitate for 10 minutes in slightly acidified water (using 1 tsp of citric acid powder per liter of water), then transfer to a sink and wash with running tap water for another ten minutes. I haven’t tried any variations of this method, so I don’t know if it’s helping or hurting. But I have done it consistently, and have gotten some really nice results (as well as some really awful ones).
John,
Usually if there is a problem there will be a message about it at the bottom of the -out file. I looked at yours and there is no message, and I don’t see any other problem with it.
Sometimes the new quad file is there but I don’t see it right away. It will have “-lin” appended to the name of the original quad - something like this: <span style=“caret-color: #5b5b5b; color: #5b5b5b; font-family: sans-serif; font-size: 15.59999942779541px; background-color: #fbfbfb;”>R2000-P2-PiezoDN-Cyanotype-lin.quad</span>
I don’t know where Windows puts these new files, but maybe you’re just looking in the wrong place.
FWIW, what I do is copy the CGATS.txt file (to which I always give a meaningful name) to the folder where the quads live - on Mac it would be Piezography>Curves>[printername] - run QTR-Linearize-Quad, then remove the txt files before running the install command. I save the CGATS in another folder and trash the -out file.
Hope this helps. I’ve forgotten why you are using R2000 curves rather than P400 (that is your printer, right?) and don’t have time to reread everything right now. From the Change Log on the Download page it looks like there should be P400 curves. Maybe you should change the R2000 in the curve you referenced to P400.
Thanks Keith! I looked again and the -lin file was there! It just took a while to show up in Windows explorer.
I’m using R2000 rather than P400 because there is no PPD (printer descriptor) file for the P400 printer in QTR – at least there isn’t one in the version I installed. I did a file compare of the two base cyanotype quads (R2000 vs P400). They’re identical.
The procedure for running linearize-quad in the manual is designed so it will be easy on Mac. On Windows it is not so easy, so I make copies all three files (GCATS.txt, the quad to be linearized, and the QTR-Linearize-Quad.exe “droplet”) in a new temporary folder. Then dragging two files onto the “droplet” is easy. I can then move the -lin.quad to the folder where it belongs.
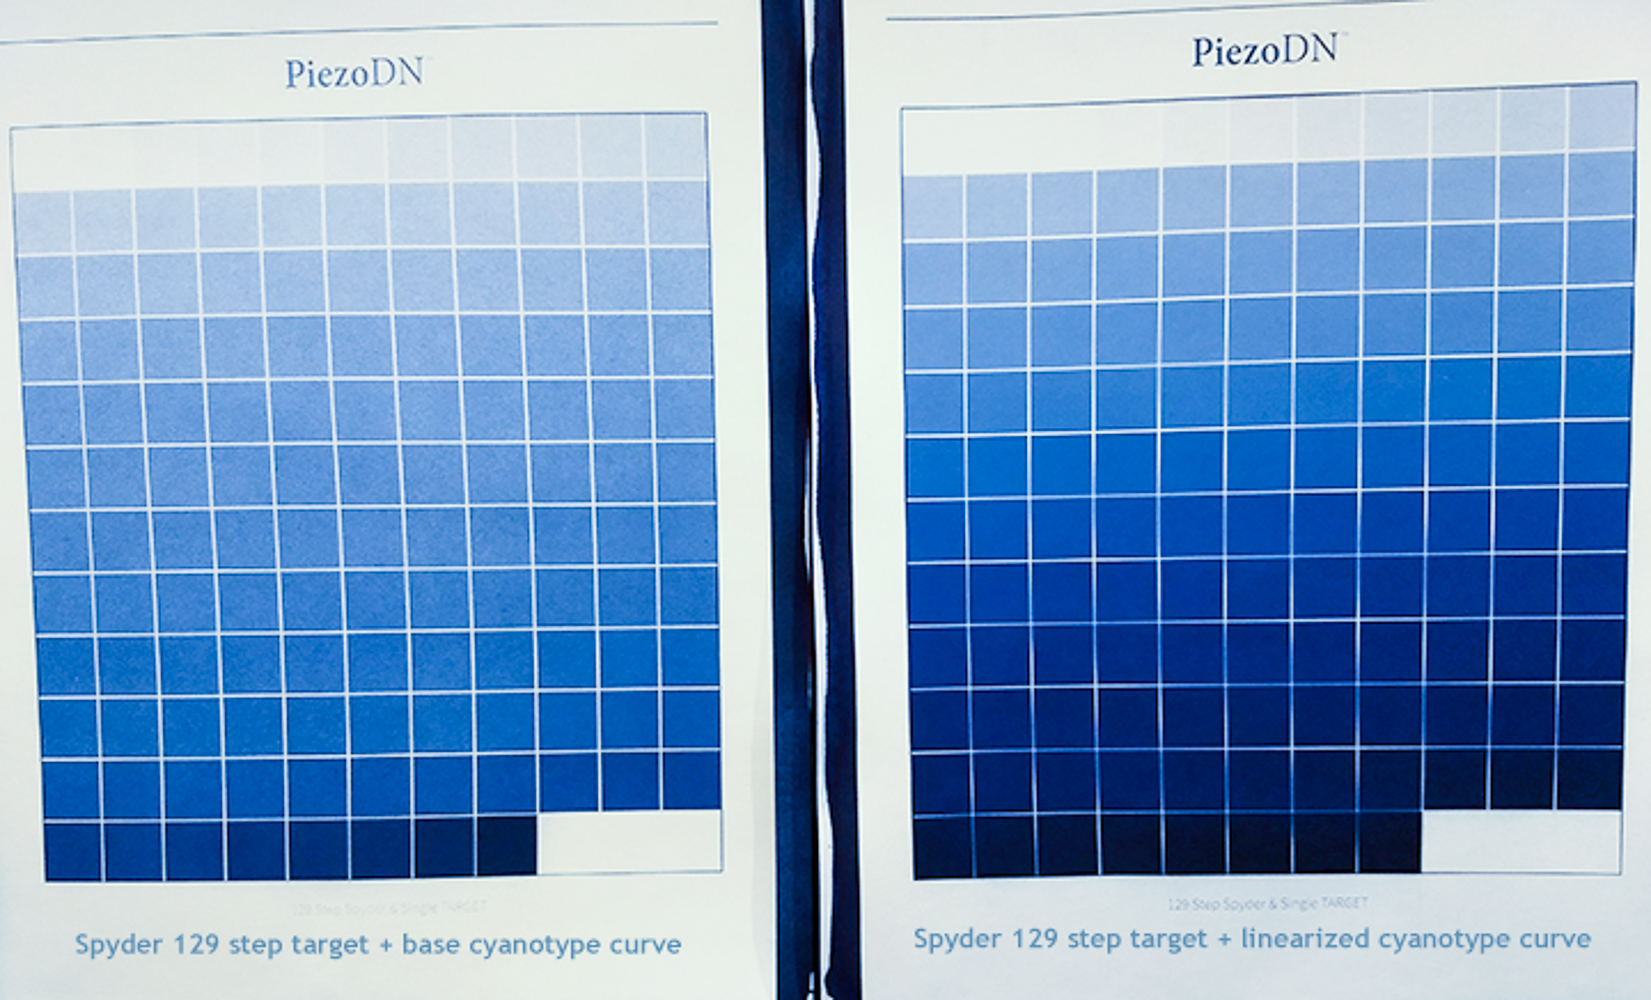
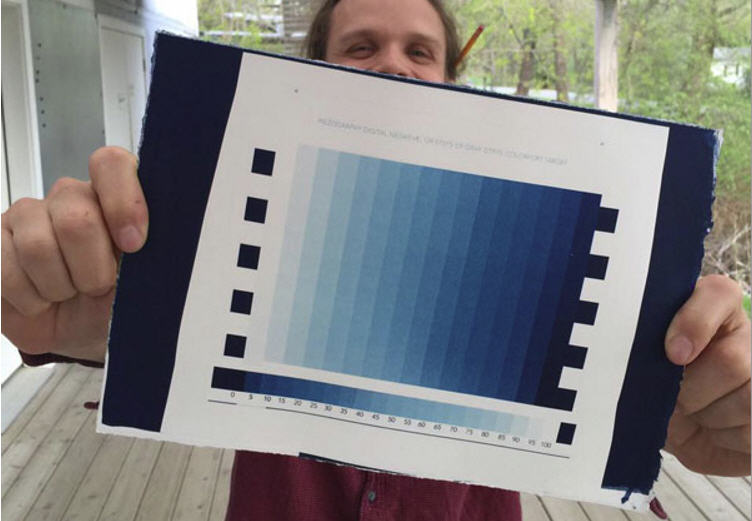
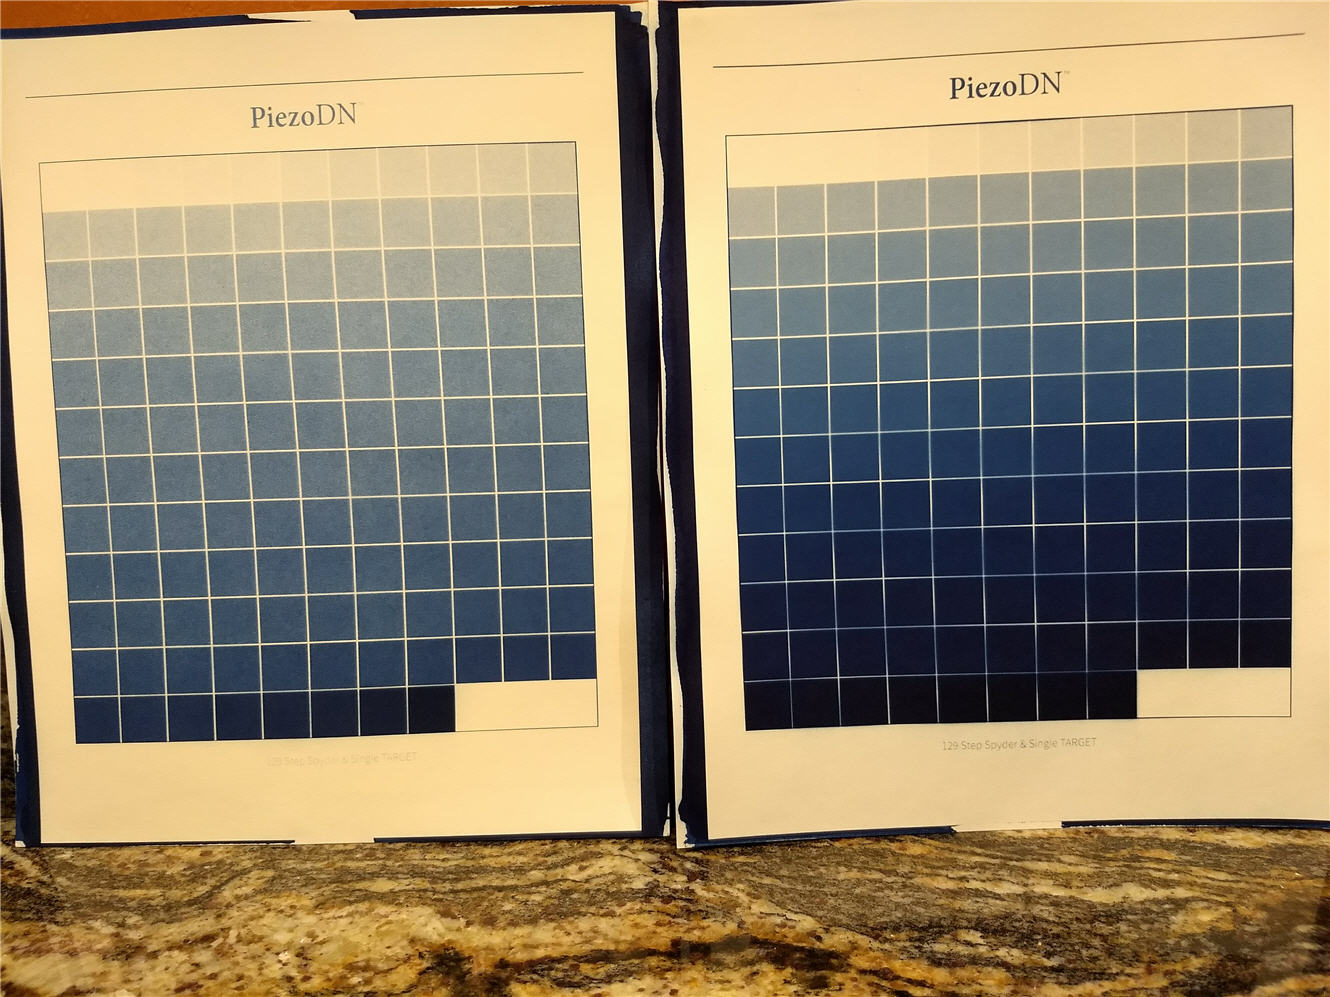
I finished linearizing a quad using my new Spyder spectro. The attached photo shows two targets. The one on the left was made with the 129-step Spyder target with the base cyanotype curve. The one on the right was made with the 129-step Spyder target with the linearized cyanotype curve. I apologize for the quality; I shot it with my cell phone.
As you can see, the un-linearized target has very high contrast in the shadows. In other words, the transition from midtones to nearly black occurs in just a few steps in the last two rows. I don’t know if you would say the highlights are also high contrast, but to my eye, the falloff from pure white to midtones appears to occur pretty quickly, certainly more quickly than in Walker’s perfectly-linearized target (attached).
The linearized target has lower contrast in the shadows (good). I still think there is too high contrast in the highlights. What do you think?
Do you think the linearized quad would benefit from another iteration of linearization?
Unrelated question: what is causing the bleeding seen in the target on the right? I don’t see any problem with the negative.
There is usually quite a bit of runoff from cyanotype which can stain the paper if not constantly agitated to prevent it from soaking back in. Maybe that’s what happened here.
As for the result of the linearization, to my eye it looks too dark in the shadows in the photo, but I’m reluctant to make a visual diagnosis. Better would be to measure and graph them together to see how close you are to linear. It’s easy to do in a spreadsheet. Or just compare the individual graphs in the Smoother tool.
I feel the same way about the shadows. I’m about to see how close to linear it is using the smoother tool.
I just edited a long post, then submitted it. It disappeared. Arrgh! So here we go again.
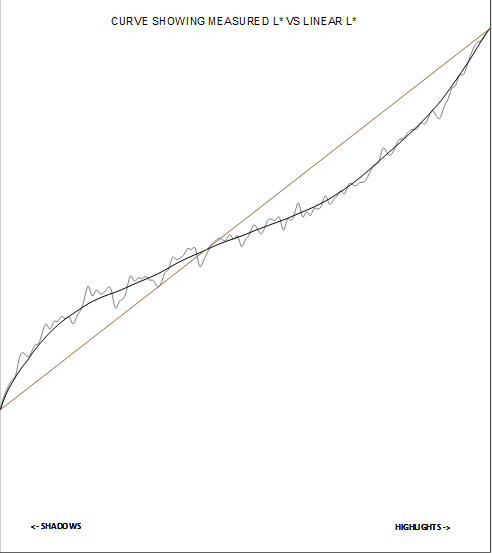
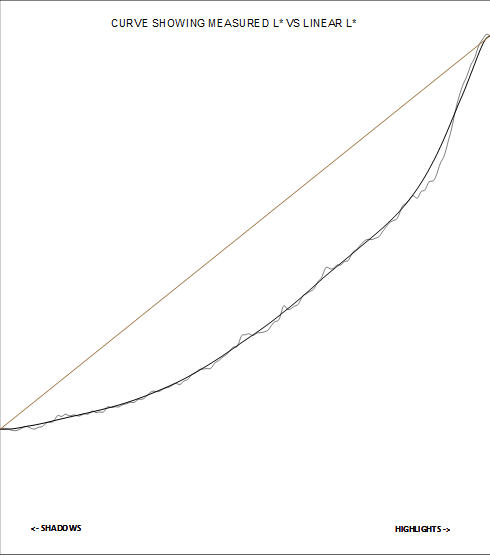
I took Keith’s suggestion and measured the target made with the linearized curve. The graph in the smoother (attachment 2) is LESS linear than the target made with the base cyanotype curve (attachment 1).
Below are the steps I followed. I did my best to follow Section 9 of the manual (“Linearizatio”), although as a Windows user, I found much of it mystifying. Because Section 9 does not have instructions for Spyder, I followed the instructions in Keith Schreiber’s excellent how-to document.
Step 1: I found the 129 step target for the Spyder in Images/PiezoDN_Targets/Spyder/
Step 2: I found the base cyanotype curve for my printer in QuadToneRIP/QuadTone/QuadR2000-PiezoDN-P2/
Step 3: I opened the target in QTRGui, applied the base cyanotype curve, and printed a negative
Step 4: I made a cyanotype print using the negative
Step 5: I used the Spyder to measure 129 target values and output a text file (graph in attachment 1)
Step 6: I used 129STEP_PIEZODN_GCATS_CMOOTHER.ods to create a GCATS file.
Step 7: I passed two input files to QTR-Linearize-Quad.exe (the GCATS file and the base cyano curve). This created a linearized quad (“R2000-P2-PiezoDN-Cyanotype-lin.quad”)
Step 8: I made another negative from the 129 step Spyder target plus the linearized quad from step 7.
Step 9: I made a cyanotype print using the negative
Step 10: I used the Spyder to measure 129 target values and output a text file (graph in attachment 2)
Where did I mess up?
Well jeez! Something ain’t right. Though the visual interpretation that I was reluctant to make from your previously posted picture of the 2 129-step targets would have been pretty close.
I seems to me that the most likely thing is that the -lin curve being generated is not right, but then the question is why. I don’t see anything obvious that you’re doing wrong.
It appears that QTRgui for Windows doesn’t have the CurveView app that the Mac version has. It gives a graphical representation of ink usage in a quad curve. Do you know if this is correct? I did find QTR-Linearize-Quad.exe. (I have the QTRgui version virtualized via CrossOver so I may not be seeing everything. I do not have the Windows version of PiezoDN installed.)
One thing that we could do as a first troubleshooting step is for you to send me your quad curves (both the Master, which should be the same as the Mac version I have, and the -lin that you made), your Spyder data file from the first round, I will then make a new -lin.quad from it and compare the CurveView of that to the one you made. If they are the same, that would eliminate the curve linearization process as the source of the problem. If they are different then, we know where to look. I think. Maybe.
You might have to zip those files to post them here. You could also send them by email.
Yes, that would be my guess too. I didn’t print any other images with it, only the “linearized” target.
Thank you for your generous offer to help!
I attached a zipped folder containing three files:
- the base cyanotype quad for the R2000 QuadToneRIP/QuadTone/QuadR2000-PiezoDN-P2/R2000-P2-PiezoDN-Cyanotype.quad
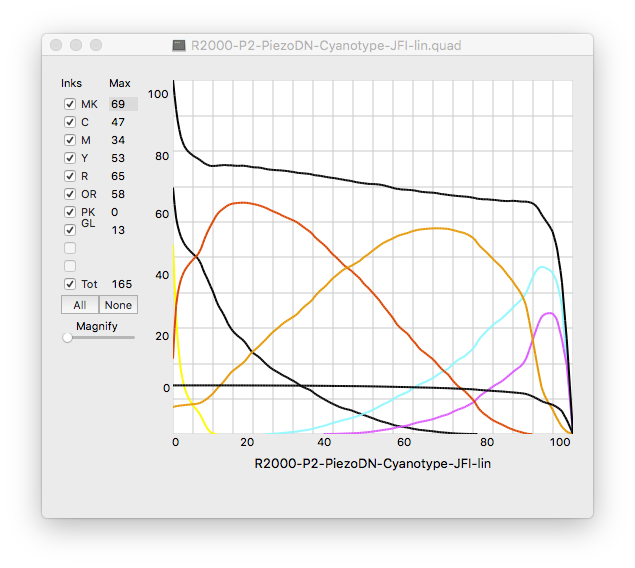
- the linearized cyanotype quad R2000-P2-PiezoDN-Cyanotype-JFI-lin.quad
- the Spyder data file used for the linearization ExportedValues.txt
piezography.zip (8.67 KB)
.[quote quote=30128]It appears that QTRgui for Windows doesn’t have the CurveView app that the Mac version has[/quote]
I couldn’t find one. “Print” seems to be the only thing that QTRGui can do.
I ran your files through QTR-Linearize-Quad with exactly the same result. I also plugged them into the beta-driver spreadsheet (which does not use QTR or any of it’s tools) and it generated a slightly different but mostly similar quad. I think I can safely say that you didn’t do anything wrong there.
Then I remembered something that happened to me once with my 1430 and its tiny carts before I got the chip resetter. Is there any chance one or more of your carts ran out of ink during the printing of the target with the -lin.quad? When it happened to me it was on an actual negative, not a target, but the effect was similar and I didn’t realize it had happened until I printed the negative.
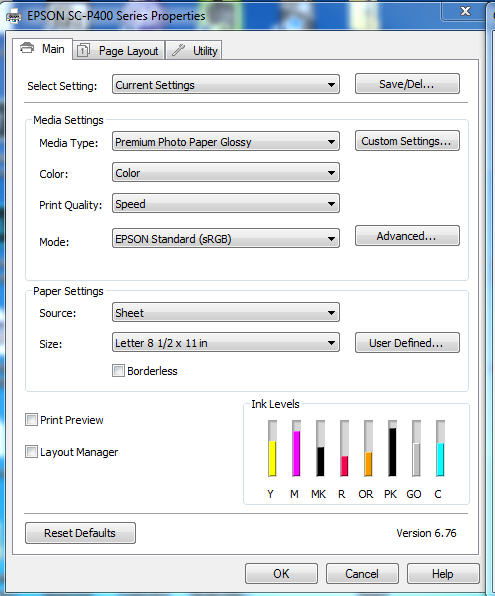
No chance! The ink light would have illuminated on the front console and I assume printing would have stopped dead in its tracks. The printer has not even not warned me that any carts are getting close to empty (see attached screenshot of printer properties). Ink levels should be accurate because I started with filled carts. I also ran a nozzle check prior to printing the negative (I always do this), and it was perfect.
I also doubt that I filled carts with the wrong ink. I suppose that could cause a problem. Although I am new at this, I was super-careful when I filled my carts for the first time (the first and only time).
The negative itself looks just fine. Beautiful, in fact!
My printer is a P400, but as I have explained elsewhere, I’m using R2000 because there is no P400 printer descriptor (PPD) file. As I understand it, the PPD tells the system about the ink carts and their configuration. What if the P400 cartridge configuration is actually DIFFERENT from the R2000’s? This would certainly cause a problem. But I have been assured that the two are identical. I did a file compare on the cyanotype base curves (QuadR2000-PiezoDN-P2 vs QuadP400-PiezoDNP2). They are identical.
Other than that, I can’t think of a possible cause except for a huge and dramatic blunder on my part. It wouldn’t be the first time!
I was only going by the status monitor. I agree that it is necessary to visually inspect the carts and not rely on the status monitor or the ink warning lights. I will pull the carts tomorrow morning and check the ink levels.
Thank you for posting the curve view. It’s very interesting! I wish I could produce one of those.
Inkjetmall states explicitly that the chip resetter for small format Epson printers does NOT work for P400 carts. There’s a Chinese-manufactured chip resetter for the P400, but I who knows if it’s compatible with the IJM carts. I can’t find anyone on the IJM forum who has used one. So until a resetter is available, we P400 owners will be at the mercy of our printers.
Since chips are replaceable, it would be nice if you could purchase boxes of spare chips (like a box of 100!). Then each time you refill a cart, simply pop in a new chip. Unfortunately (1) the replacement chips are very expensive and (2) they’re not available for the P400 anyway.
This ARC auto reset chips are expensive and most of the cost of the cartridge so this is why we do not sell them separately.
Most often if you see a cartridge empty (with ink levels still registering high on the printer) this is because you did not refill it after it reset. These large-sized cartridges have about 18.6mL of ink in them and the ARC chips will reset after 12.5mL of ink is used on the P400 (different on the 1430 with smaller carts).
best,
Walker
After reading posts about how others are dealing with P400 cartridges, given the lack of a chip resetter, I came up with the following strategy.
Like Keith, you could top off your carts before each printing session. In my case, since I rarely make more than one or two prints in a session, I would keep a tally of the prints I’ve made. When the tally reaches a certain number, TOP OFF ALL CARTS. I’d use a number like ten because I know I can get AT LEAST ten 8.5 x 11 prints with full carts, probably quite a few more than that. The only time I will top off carts is at this fixed interval.
Ignore the status monitor! It is less than useless.
The ink light will go on in mid-print when the printer “thinks” a cart is empty. Instead of having to remove and refill the cart, simply pop it out and immediately pop it back in. The chip will reset and the printer will resume printing.
A cascade of ink lights may occur during a single print. So what! Simply pop out and pop in as each light goes on.
Is there a flaw in this strategy? Is there a better way?
This morning I pulled all the cartridges. Every cartridge was between half-full and two-thirds full. I topped all of them off. So now I have no reason to ever again look at ink levels in the status monitor.
Something odd happened when I pulled it the PK cartridge. It dripped slowly from the ink outlet. This probably means the spring-loaded valve was stuck. I topped it off as quickly as possible and replaced it. I hope this was not a foolish thing to do. I have a brand-new PK cart. Maybe I should have used it instead.
Let me see if I understand exactly what you did.
- You took the exported values from my Spyder (exportedValues.txt) and linearized them in the Smoother tool, creating a CGCATS file.
- You dropped the CGCATS file and the base cyanotype curve which I sent you onto the QTR-Linearize-Quad "droplet," creating a linearized quad.
- You did a file compare of your linearized quad and the the one I sent you, and found them to be identical.
- You made a plot of the linearized quad using the Curve View tool.
When I did this, the Smoother tool plot in Step 1 told me that the base cyanotype curve is already doing a pretty good job (attachment 1 and left side of attachment 3). The mild S-curve is already pretty close to linear. But when I printed a target using using the linearized curve, the result was clearly not very linear at all (attachment 3, right side). It looked much too dark, just as you observed. And when I measured the target with my Spyder and plotted the values in the smoother, I got the curve in attachment 2, which agrees with our observations.
So the question is: what have I done to make the result worse, rather than better? I still think it is something I’m misunderstanding about linearization. I suppose it could also be a “darkroom variable” but I am hard-pressed to imagine what variable could produced such a radically bad result. One thing: I did not allow the negative to dry overnight. I dried it 20 sec with a hair dryer and let it sit for an hour. I don’t think that could fully account for it.
The only flaw here is that certain ink shades are used more rapidly than others and it is those shades, usually 3 & 4, that will set the pace.
Yes.
Exactly, but be sure none of them are actually approaching empty.
Yes.