I’m about to start working with a process that doesn’t have a “master” curve in PiezoDN. I will have to choose one of the existing curves and linearize it. The question is: Which curve should I choose? I know from experience that starting with the wrong curve can waste a lot of time and ink.
I know how to plot the D/logH curve for my process. If I show you the curve, can you tell me which master curve is the closest approximation? Of course it would be even better if PiezoDN had a selection mechanism built in.
Please share the required LOG densities.
best,
Walker
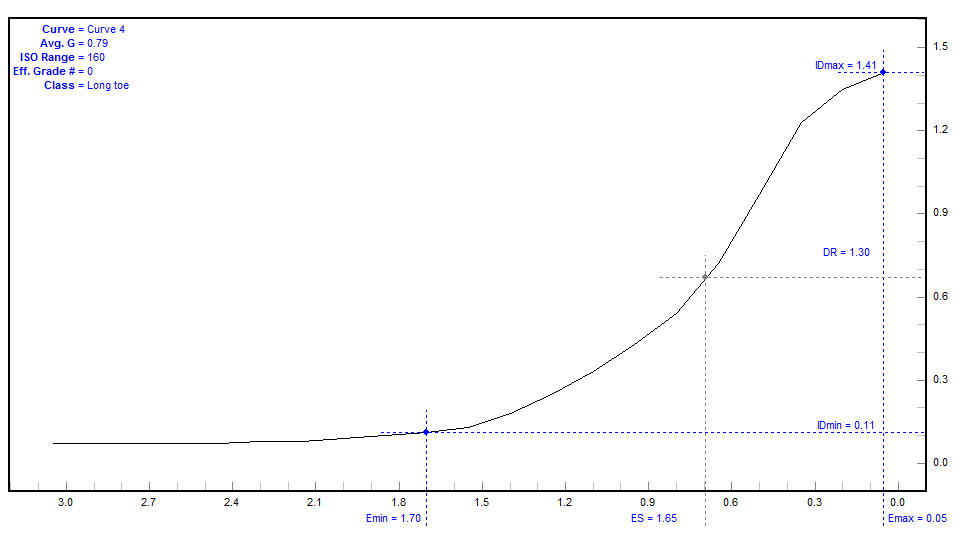
Dmax = 1.410
Dmin = 0.070
DR = 1.340
If you will tell me what starting to curve to use, that would be fine. But if you will also tell me how you chose it based on this information, that would be even better!
No curve currently published is limited to 1.41.
That being said if you print a 256 step target using the master curve and upload the printed measurements I will limit it to the correct (first) spectral white highlight using PPEv2. This will limit to the correct density.
best,
Walker
Hi John,
Forgive me for butting in, but Density Range (DR) is not the info you need here. Processes with very similar DRs can have very different Exposure Scales (ES). ES is what you need to look at. (John knows what I’m talking about.) In BTZS Plotter you can set the IDmax at either 90 or 100% and compare it to a known process plotted the same way. Or post the values here and I’ll steer you in the right direction. What process is it, btw? NC?
Keith
It is my hope to someday support film calibration to ES scales. All the math is built already . . .
best,
Walker
Hi Keith,
With IDmax% = 100%, Plotter says Emin = 1.70, Emax = 0.05, and ES = 1.65.
The densities that I input for the curve were the covered values.
Yes, New Cyanotype.
OK. A bit of background. The BTZS Plotter has been around for probably 30 years or so. I’ve been using it since the early 90s myself, but mostly for printing from original large format negatives. If you have read Dick Arentz’s Platinum & Palladium Printing you may be somewhat familiar with the concept even though I know you are not a film guy. Phil Davis, the author of Beyond the Zone System and it’s associated apps was Dick’s teacher at the University of Michigan in the 70s.
Recently, since most of my work these last few years has been with digital negatives, I’ve wondered how the concepts in the Plotter could be applied to digital negatives. The analysis part is clearly different since digital negs are not constrained by the characteristic curve of the process the way analog negs are. The reason the default Emax setting in Plotter is 90% is that this is the ANSI/ISO standard for black and white printed on gelatin silver paper. Same for the Emin setting of 0.04 over paper base white. These settings work well for Pt/Pd for printed from analog negs too. But for digital negatives we have the ability to linearize the entire exposure scale and thus eliminate the toe and shoulder. In theory this means we can set the Emax to 100% and the Emin to zero. Plotter allows us to set the Emax, but Emin is fixed at 0.04 over paper base. I’d like to be able to adjust both ends.
The spreadsheet that I recently shared with you ( and will be sending to you too Walker) is my first attempt at creating a more flexible analysis tool, and also one that can work with Luminosity (L*) values rather than (or along with) density. The Density part is easy since I know the formulas, but for the L* analysis I had to come up with something that produced similar results, but because the scales are so different, and my math skills very rusty and crude, I’m doubtful that they will work with all data sets. I also had to select the cells to use to define the white point manually which will change once I figure out how to automate it.
Back to your immediate situation. A typical ES for Pd with an IDmax setting of 100% is typically around 2.40-2.50, though I’ve seen a few papers a bit higher and lower. This is about 2.5 stops more range than your New Cyanotype (NC) test is showing. This means you need to limit the master curve by a substantial amount. The procedure for doing that is in the manual. It’s a little tricky the first time, but I think you can handle it. Or you could try the Cyanotype curve for your printer and inkset. (P400 & K7 Se?) I think the supplied cyanotype curves are for the classic formula, so it may even be too low contrast for NC, but it’s worth a try.
Didn’t we go through limiting for NC early last summer?
Enough for now. See you in Tucson next week.
Keith
1 Like
New smoothed Cyanotype master for P400.
P400-Cyano-Master.quad (9.6 KB)
Best,
Walker
Keith,
Yes, we did try the limiter early last summer, but I was having so many other problems with my process that the results were inconclusive. After fixing the problems, I was able to linearize a quad starting with the master (which I believe is based on Pt/Pd).
I re-profiled my process once again a couple of months later when I mixed new chemistry. Once again I was successful linearizing starting with the master curve. So the high ES doesn’t seem to have been a problem.
If limiting were needed, wouldn’t it become apparent when the top row of a 129-step target had several leading cells that were all white? When I print a target made with the master, I get nice gradation in the top row. Only the first cell is paper white.
John,
I guess I forgot that you had abandoned the limiting process. But weren’t you later having some issues with blown highlights? (If so, there is a connection.)
I need to limit the Master for palladium which has a much higher ES than NC, so it’s hard to imagine that making a custom limited master for your process wouldn’t be beneficial. I think many folks could benefit from learning to do this. A properly limited starting Master for your process with your particular way of working takes a lot of stress off of the linearization step. There are limits (haha) as to what can be done using linearization only. This may be relevant to your recent struggle with linearizing the new batch of NC solution.
Try the new curve that Walker posted above.
Keith
I’m all for anything that eliminates stress from the linearization step!
Before trying limiting, or trying Walker’s new curve, I want to rule out variations in exposure as the source of my problems. I’m using a PPM-2 for exposure. I printed a target with the Master curve today, using the standard UV dose we determined. It is still drying, but it looks promising. If it fails to linearize, I can rule out exposure and move on to the next step. Maybe start with the P400 curve, which hopefully does not need limiting.
I had assumed that a sure sign you need limiting is when highlights are blown out in the top row of the target. Which happens because the curve you’re using is laying down too much ink in the highlights? I have never seen that happen. In fact, when I print the target with the master, I see a nice gradation of tones in the top row.
Thank you, Walker. I will try it and let you know how it works.
Here is the Plotter curve, showing the ES
That’s interesting. This suggests that you are getting about a 1/2 stop (0.15) shorter scale than I found with NC on Platine. (You are printing on Platine IIRC.) One explanation could be that my tests were conducted without partially covering the Stouffer with Pictorico OHP. Tests with Pd on Platine 145gsm that I’ve done over the last week or 2 do show a decrease in ES when comparing the OHP covered curve to the uncovered curve. I’ve never plotted curves for OHP covered Stouffer tests before.
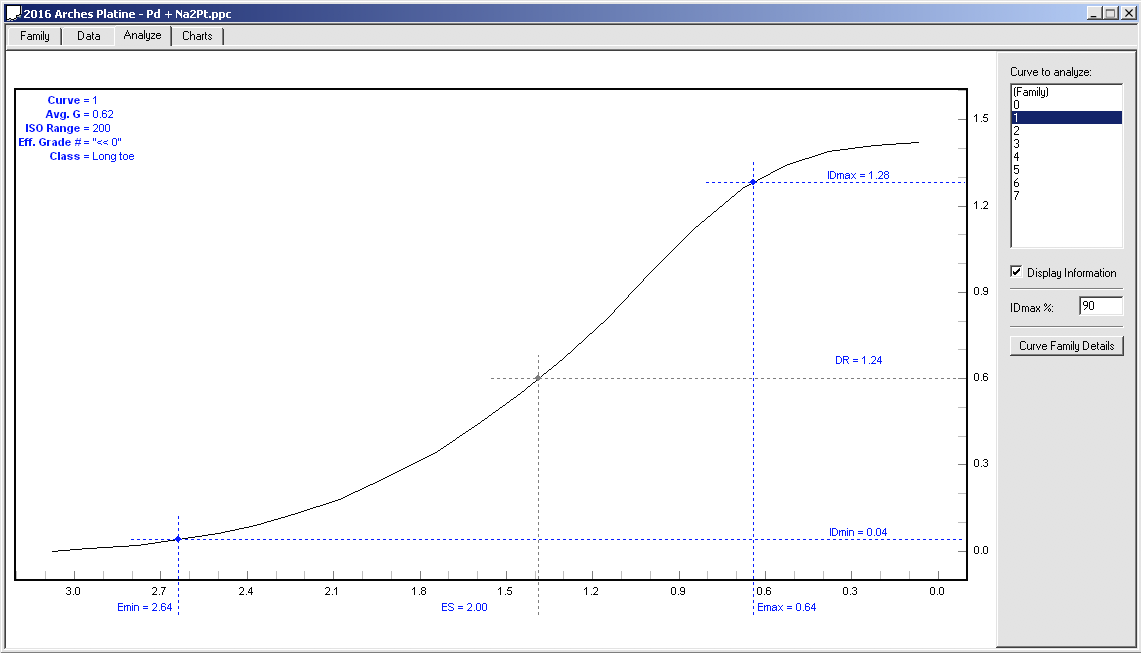
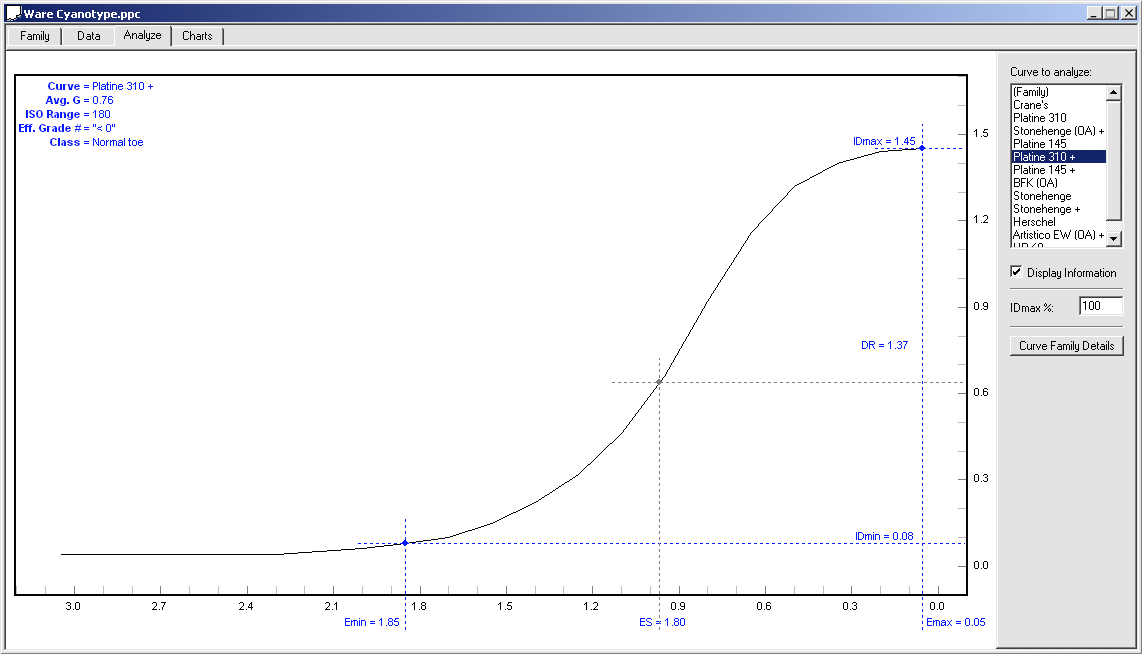
Here are 4 Plotter graphs for comparison. The first 2 are NC on Platine analysed at IDmax 90 and IDmax 100. The second pair is Palladium on Platine analysed the same way.
The ES results are as follows:
Pd @ 90% - 2.00
NC @ 90% - 1.34
Pd @ 100% - 2.57
NC @ 100% - 1.80
If you compare the ES of Pd to NC at 90%, the difference is 0.66 (2.00 - 1.34) or about 2-1/6th stops.
At 100% the difference is 0.77 (2.57 - 1.80) or about 2-1/2 stops.
It seems impossible that the same Master curve could work for both processes. In fact when calibrating PiezoDN for NC last spring I had to limit the master to eliminate the K ink almost completely. Here are the CurveView graphs. Notice the black line at lower left of each graph.
I’ll bring some samples to Tucson next week so we can compare some actual target prints in person and maybe make more sense of it all.
Keith
Keith,
Thanks for posting the curves. I was going to ask about the ES for Pd vs NC. I see now that the difference is quite large. This suggests that Master is not a good starting curve for linearizing NC.
However…
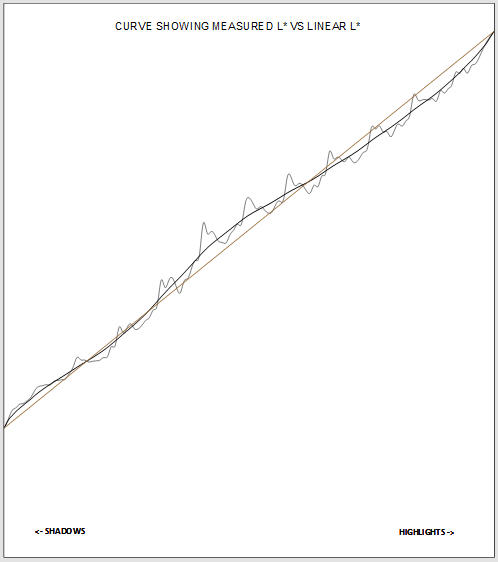
Using a PPM-2 meter to measure exposure, I printed another 129-step target made using the Master curve. The target looks almost linear, and the smoother seems to agree. Now if I can do a QTR-linearize-quad and get even closer to linear, I’ll be convinced that Master is OK to use as a starting curve for NC, and that my problems have been due to inaccurate exposure, the hypothesis I am currently testing.
Next, I will linearize Master with this CGATS data. The adjustments to the Master should amount to a few simple tweaks to the six ink curves. I can’t imagine that a linearized Master will be WORSE, but we shall see!
That is bizarre! Are you sure you didn’t limit the master and maybe forget to rename it?
Which curve was used in the above target?
The curve is R2000-P2-PiezoDN-Master.quad, the one that ships with PiezoDN-Windows, untouched by human hands. I made a negative with that curve back in July (two bottles of NC ago) and have used the same negative to start all my linearizations. Those earlier linearizations took two or three iterations to converge. The big difference now is that I am measuring exposure with a dose meter, rather than relying on time. I wonder if the earlier linearizations would have converged more quickly if I were exposing by dose, rather than by time.
The Smoother graph above looks pretty much like the the plot that you showed me a couple days ago comparing your nc5 linearized curve to the master with your new batch of solution (nc6). The x-axis is reversed but otherwise it looks very similar to the master curve (red) line. Is that correct?
Here it is flipped:
If so, that is damn good from the master! Have you linearized yet?
By the way, you can reverse the order of the x-axis by checking “Categories in reverse order” in the axis options. You can also add a straight line from Dmin to Dmax by adding another data series with just those 2 points and setting “Show empty cells as” to connect the points with a line.
I still can’t wrap my head around how it is possible that a shorter scale process is not needing the master curve to be limited. Must be something peculiar to your printer or printer model, or maybe your bulbs, etc. How knows?
Keith