Keith,
Thanks for the plotting tips. I was wondering how to do that.
The red and blue curves in your plot are as you describe, only they were timed exposures. The latest exposure was done with a PPM-2 using the standard dose determined using your method.
Looking back on my previous difficulties linearizing, I realize now that exposure differences were probably a big factor in failures to converge. In my recent tests with the PPM-2, I found as much as 1/6 stop difference between time-based exposures. That much difference could flip a smoothed curve from convex downward (overexposed) to convex upward (underexposed). I saw that that pattern a lot, and I blamed QTR-Linearize-quad, but QTR-Linearize-quad was probably doing a good job. But when I printed a target with the linearized curve and then (say) underexposed it, the curve flipped over the diagonal. The effect of exposure overwhelmed the effect of linearization.
It would be useful to model (mathematically) the effect of fractional stops of over- and under-exposure on a straight line. It’s just a gamma function, I think.
So maybe the conclusion is: Linearization is extremely sensitive to variations in exposure. If you’re linearizing, you must use a dose meter.
I made a new target negative with master-lin. I will print a target tonight and measure it tomorrow morning.
I don’t know how to do it mathematically, but I can certainly do an empirical test in the darkroom.
it would have to be done from a linearized digital target, not a Stouffer tablet. Sounds like a good idea - I’ll do it when I return after the holiday using my first PiDN-Dye linearization.
My printer model is QuadR2000-PiezoDN-P2. I renamed your quad as P400-Cyano-Master.quad as R2000-P2-PiezoDN-Walker-Cyano-Master.quad and put it into the printer model directory.
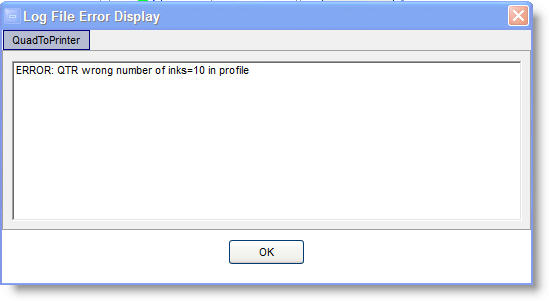
When I printed a negative (spyder target + your quad), I got this:
and the negative is no good (black cells white and vice versa with no particular logic to it).
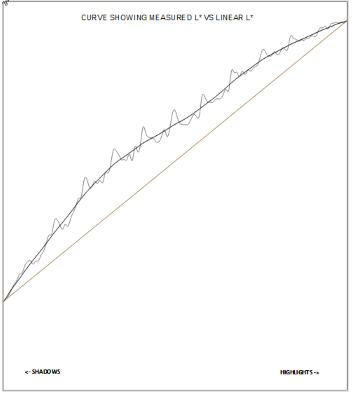
Re linearizing: I made the master-lin curve and printed a target. I could see right away that it was overexposed everywhere. Smoother confirmed it:
I will re-print the target in case it was a darkroom problem.
I also tried Walker’s Cyano-Master. There were problems with the quad file (wrong number of channels). If he fixes it, I’ll try it again.
If I may pick a few nits regarding the interpretation of curves and how we talk about them:
-
If you are speaking of the print (which is what the graph represents), this is not overexposed. The graph shows that it is light (above the line) except for the end points. An overexposed print would be below the line, and more importantly there would be a flat (horizontal) section in the deep shadows at the lower left extreme.
-
If you were talking about a film negative it might be overexposed or it might be overdeveloped or a combination thereof.
-
Overexposed really doesn’t apply to digital negatives at all, though it could possibly be called overinked.
-
This shows that the negative is too dense, and the print too light, thought the end-points are fine. This is not the same as overexposure
-
The linearization seems to have added density to the negative throughout the scale. From your previous screenshot of the master result, it should have added a little in some areas and subtracted a little in others.
-
Unless you are still having inconsistent exposure, which seems unlikely, this suggests a problem with the linearization.
I have an idea: Send me your data files from the Master and the -lin. Just the raw data, not cgats. I will make linearized curves curves from the master using both the Smoother and the new PP tool and compare them to yours. If there are significant differences that might point to an OS problem.
I looked at the curve Walker posted above and I see only 8 channels. There are 2 channels worth of empty lines though. This is not a problem on Mac but maybe it is on Windows.
Hi Keith,
Thanks for the improved terminology. I have struggled with to find the right words. Yes, too dense a negative produces too light a print.
QTRGui popped up the warning when I printed with Walker’s curve. I allowed the negative finish printing. The negative is definitely (I’m looking for the most appropriate technical term here) FUBAR.
Attaching the two files you requested. The txt file is raw data from Spyder.
R2000-P2-PiezoDN-nc6-Master-lin.quad (10.4 KB)
11-16-2018-1.txt (2.6 KB)
I am about to reprint the Spyder + master-lin target to double-check the result.
I need the data file from your print of the master too. That is the one I want to use to make a -lin curve on my end to compare to yours.
Those text files are the same - I need both master and lin.
The second text file should have been
11-17-2018-1.txt (2.5 KB)
1 Like
Whoops. Rolling too quick last night.
P400-Cyano-Master-2.quad.zip (4.2 KB)
Walker,
Could you say a few words about what you did? I hate magic.
I think I was using an old curve when I made that smoothed cyan. This old curve had extra data at the bottom that I forgot to delete.
best,
Walker
So why was the cyan curve not smooth, and what can we expect as the result of smoothing it? I’m definitely willing to try it, but if it works, I’d like to understand why.
Comparing (using Beyond Compare) your -lin.quad to one I made from the master with your data after running it thru Smoother, I see a number of very slight differences in ink value (+/- 1-5, mostly 1) but nothing alarming.
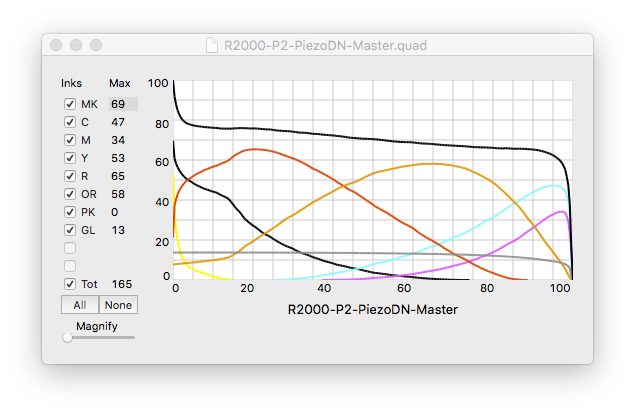
Looking at the Master and Master-lin curves in CurveView, I do see something unexpected.
The -lin curve is using more PK (Y line) than the Master. It’s also using more shade 2 (MK line). This should bring the negative highlight densities up to lighten highlights in the print.
Slightly less shade 3 (R) and shade 4 (OR) should bring down the midtone hump.
Shades 5 and 6 (C and M) are mostly the same but slightly reduced in the extreme shadows which should bring down the shadow hump.
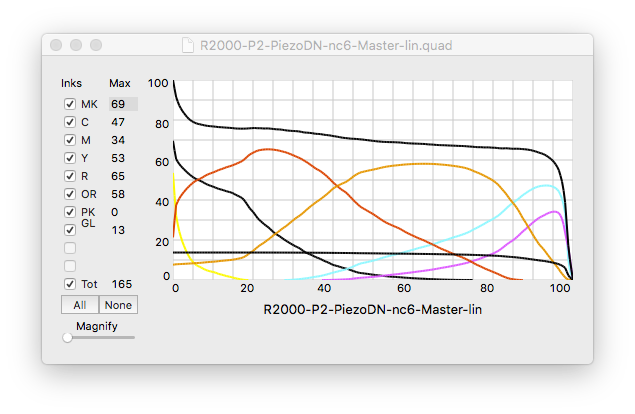
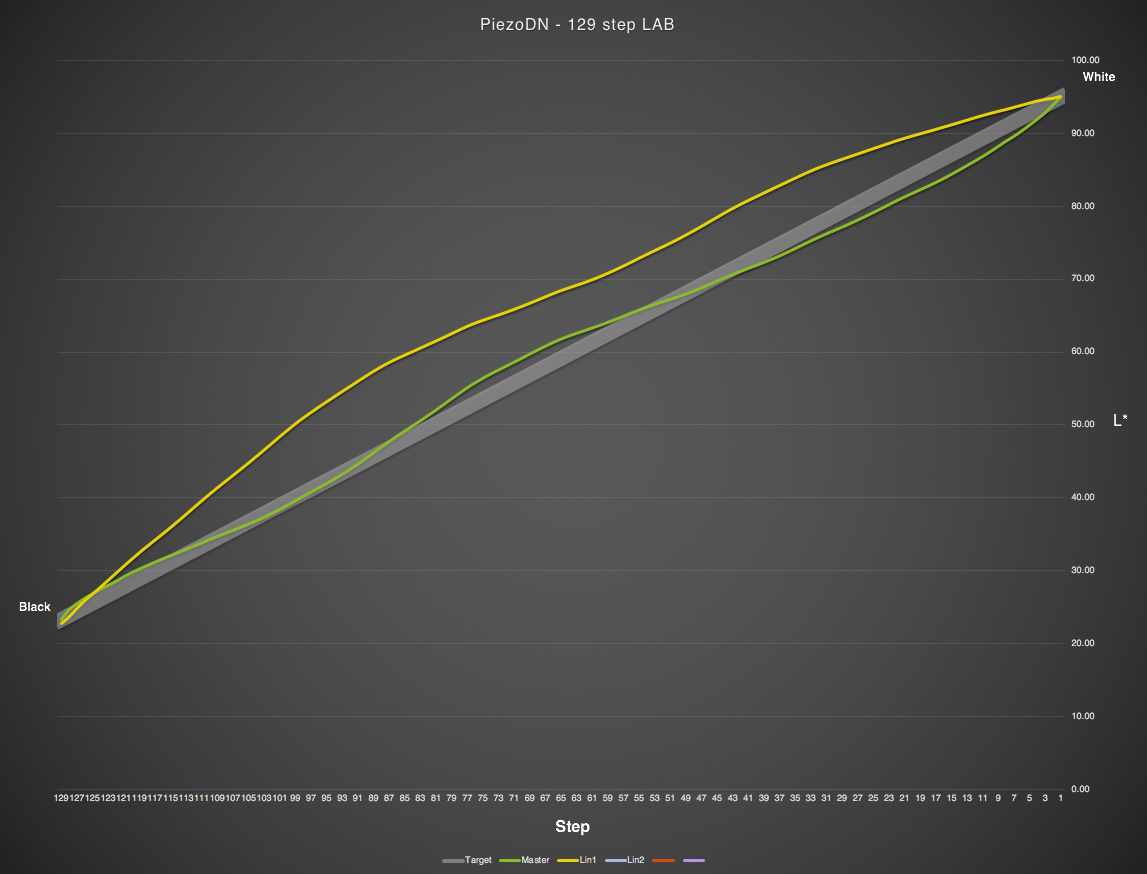
But this is not what happened - rather the entire print curve (other than the extreme shadow end) became lighter by a significant degree. Here are the 2 curves plotted together which may help in the visualization:
I really don’t know what is wrong here and unfortunately I’m out of time for now. Hopefully by the time we meet up in Tucson you will have it all sorted out.
Surely you’re joking Mr Schreiber.
Thank you for analyzing the ink curves. I hope to be able to do it myself when I switch to PPEv2. I can see the small differences you describe. They are pushing the curve in all the right directions by small amounts, as you would expect, given how close to linear the Master curve already is.
But, as you said in an earlier post…
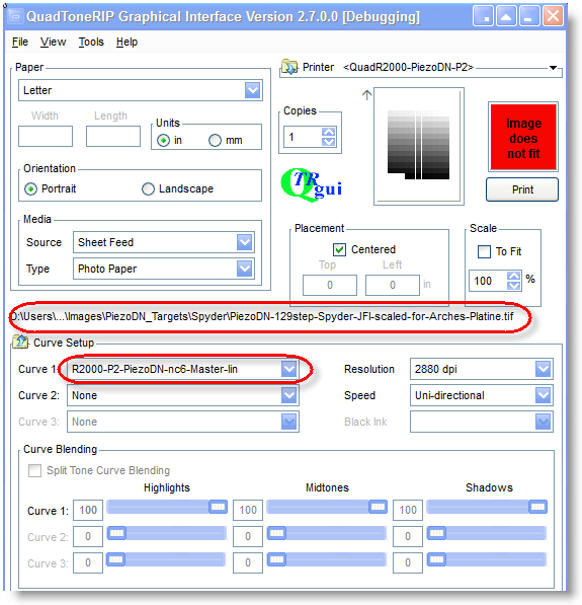
But you just showed that master-lin (which is the result of linearization) looks just fine. So where is this “extra density” coming from? Could it be something I’m doing wrong in printing? Here is my QTRgui screen
:
Every target I print is from the same tif. I scaled it so it would fit on slightly smaller sheets of Arches Platine. It is Gray Gamma 2.2 with no embedded profile. I have used the same tif to print all my targets.
Today I re-printed the spyder + master-lin in order to rule out darkroom problems. It’s drying now, but I could see immediately that it’s nearly identical to the previous print – way too light. I will measure it and smooth the measurements just to be sure.
A problem this big must have a simple explanation.
Walker,
Would you please take a look at my most recent post, in which I included a screenshot of my QTRGui screen? Keith analyzed my linearized quad and concluded that it does all the right things. It makes very small adjustments. But when I print a target negative with the linearized quad, the negative comes out much too dense. Where is this extra density coming from? Could it be something I’m doing wrong in QTRGui?
The target tif file is Gray Gamma 2.2, no embedded profile. I scaled it to fit smaller sheets of Arches Platine, then resampled to 720 ppi.
The way to use the scientific method here is to print a 21step target using the first curve and a 21step target using the second curve. (but a black background on things so you don’t waste ink) If they are the same (and they are dense) it means something was off with the first target print.
best,
Walker
Thank you. I already have reason to believe that there is “something wrong with the first target” and I am exploring it now.
I’m not joking at all (hehehahahoho) and please don’t call me Shirley!
There may be a clue right here. How do you know it is gray gamma if there is no embedded profile? Did you assign it when first opening the target in Ps? It certainly didn’t start that way. There is nothing that we can see that indicates it is GG2.2. Walker has said that the target files are hard-coded with GG 2.2, but you have modified the file and may have inadvertently changed something. I speak from experience. You know I use modified targets to which I add a 21-step strip and an area for text. I also save it with a masking edge and keep it right-reading rather than flipped. Early in my PiezoDN adventure I screwed up somewhere - I think I assigned it GG 2.2 when opening - which produced some unexpected results. You must be absolutely sure to select “Leave as is (don’t color manage)” in the Missing Profile dialog when opening these targets in Ps.
I’m not sure this is the problem here, but it is a possibility.