Keith, how very generous of you to offer but the ColorMunki is now working. Xrite support knew exactly what to do.
Thanks for all your support.
Catherine
Keith, how very generous of you to offer but the ColorMunki is now working. Xrite support knew exactly what to do.
Thanks for all your support.
Catherine
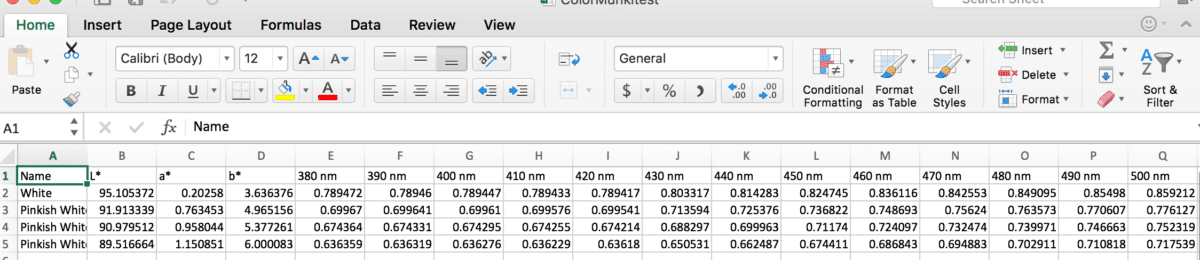
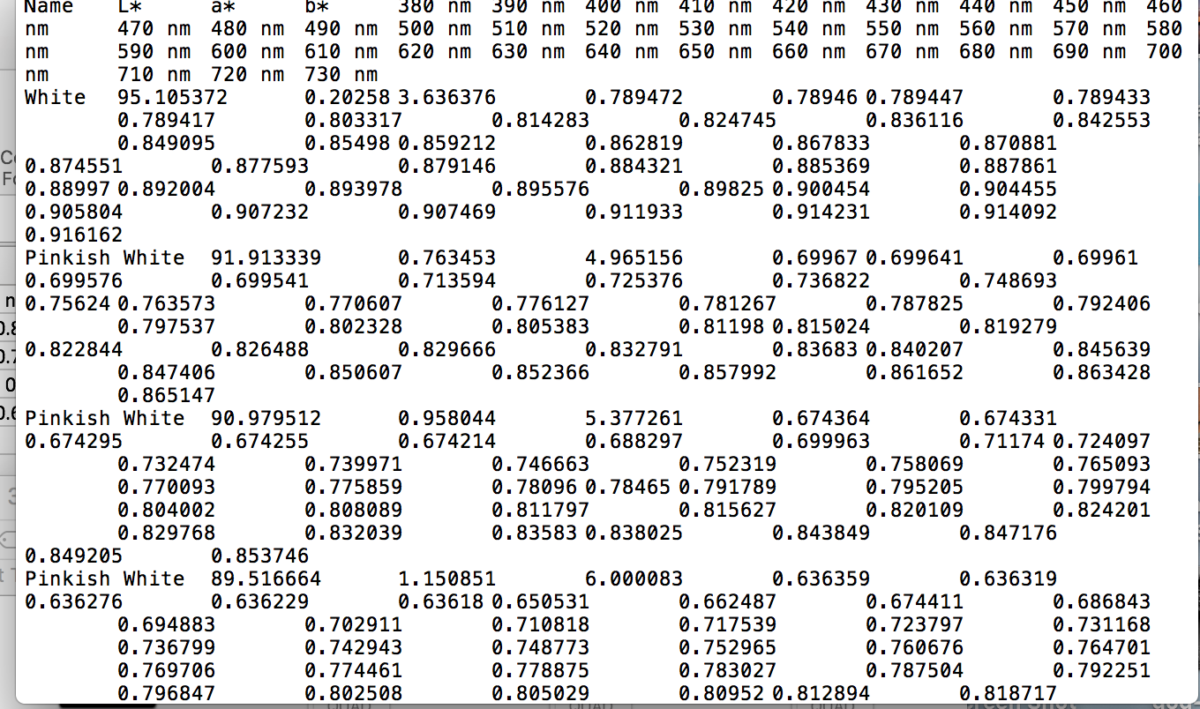
I am using ColorMunki and after the measurements my choices to save the file are comma separated, adobe color, adobe swatch exchange, quark color library, Corel Paint color file or X-rite color exchange file. I have saved the readings as a csv file. This file opens as an excel file and all the cells are filled with numbers in additon to the L a b numbers. I know very little about working with Excel. I clear all the numbers except the L a b columns. Then I try to save this as a txt file. When I open that txt file it is a mess with numbers all over the place. Maybe I thought I cleared all the extra numbers but didn’t. I will post screen shots.
Then I have to post these numbers in the CGATS template. Right?
I think I am confused now. : )
These screen shots are only partials. If you want to see the whole thing let me know.
[attachment file=1325]
[attachment file=1326]
OK! I put the CSV file in a Google spread sheet but I cannot figure out how to convert it to a text file.
I do not see any choices to make a text file.
Thanks again. I will get this eventually! ; )
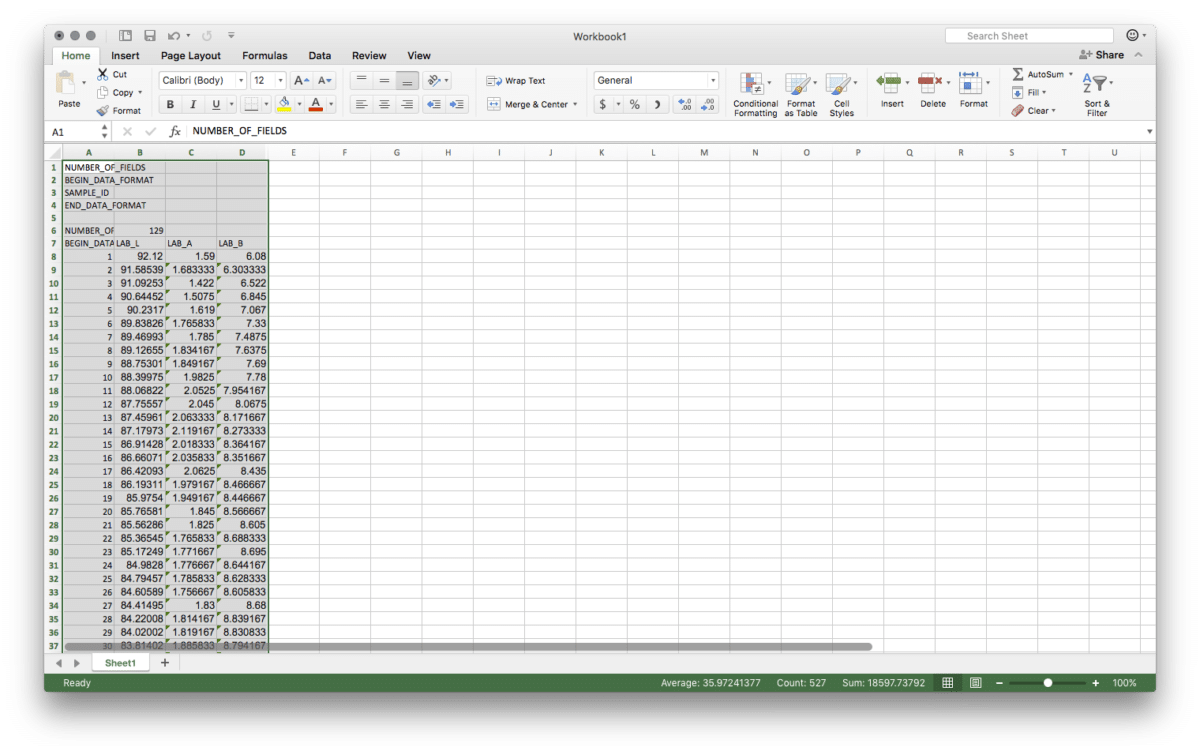
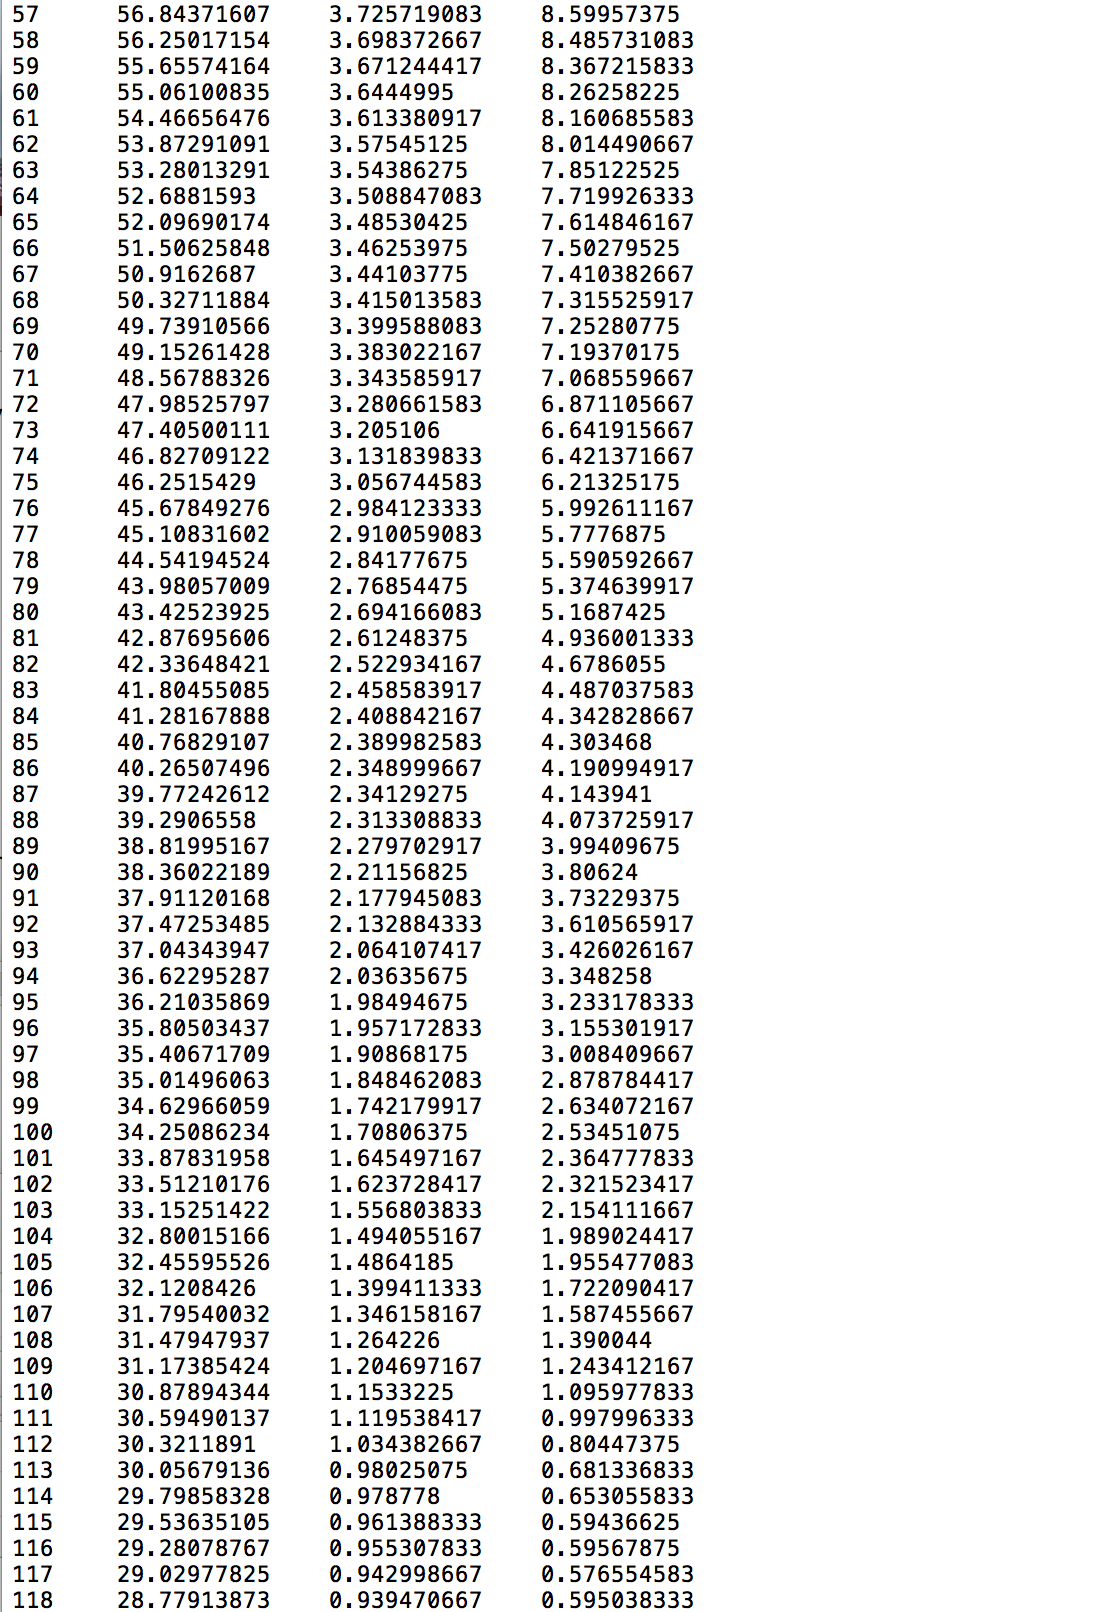
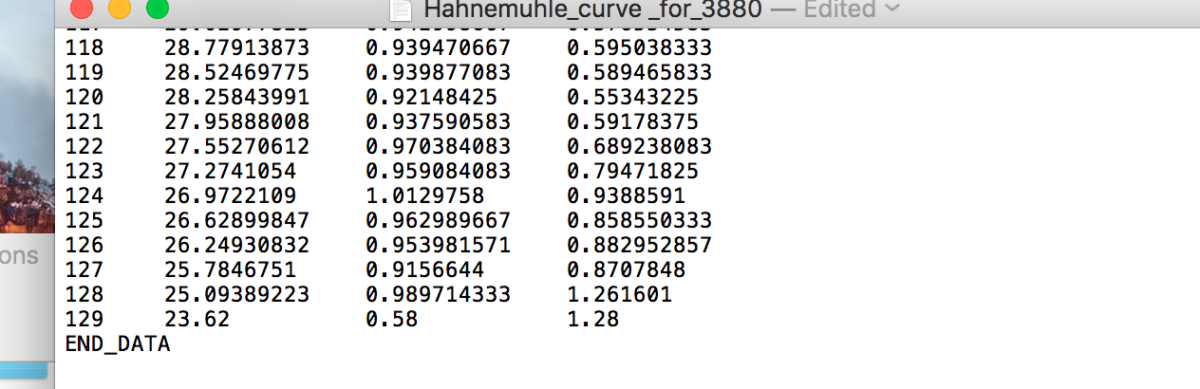
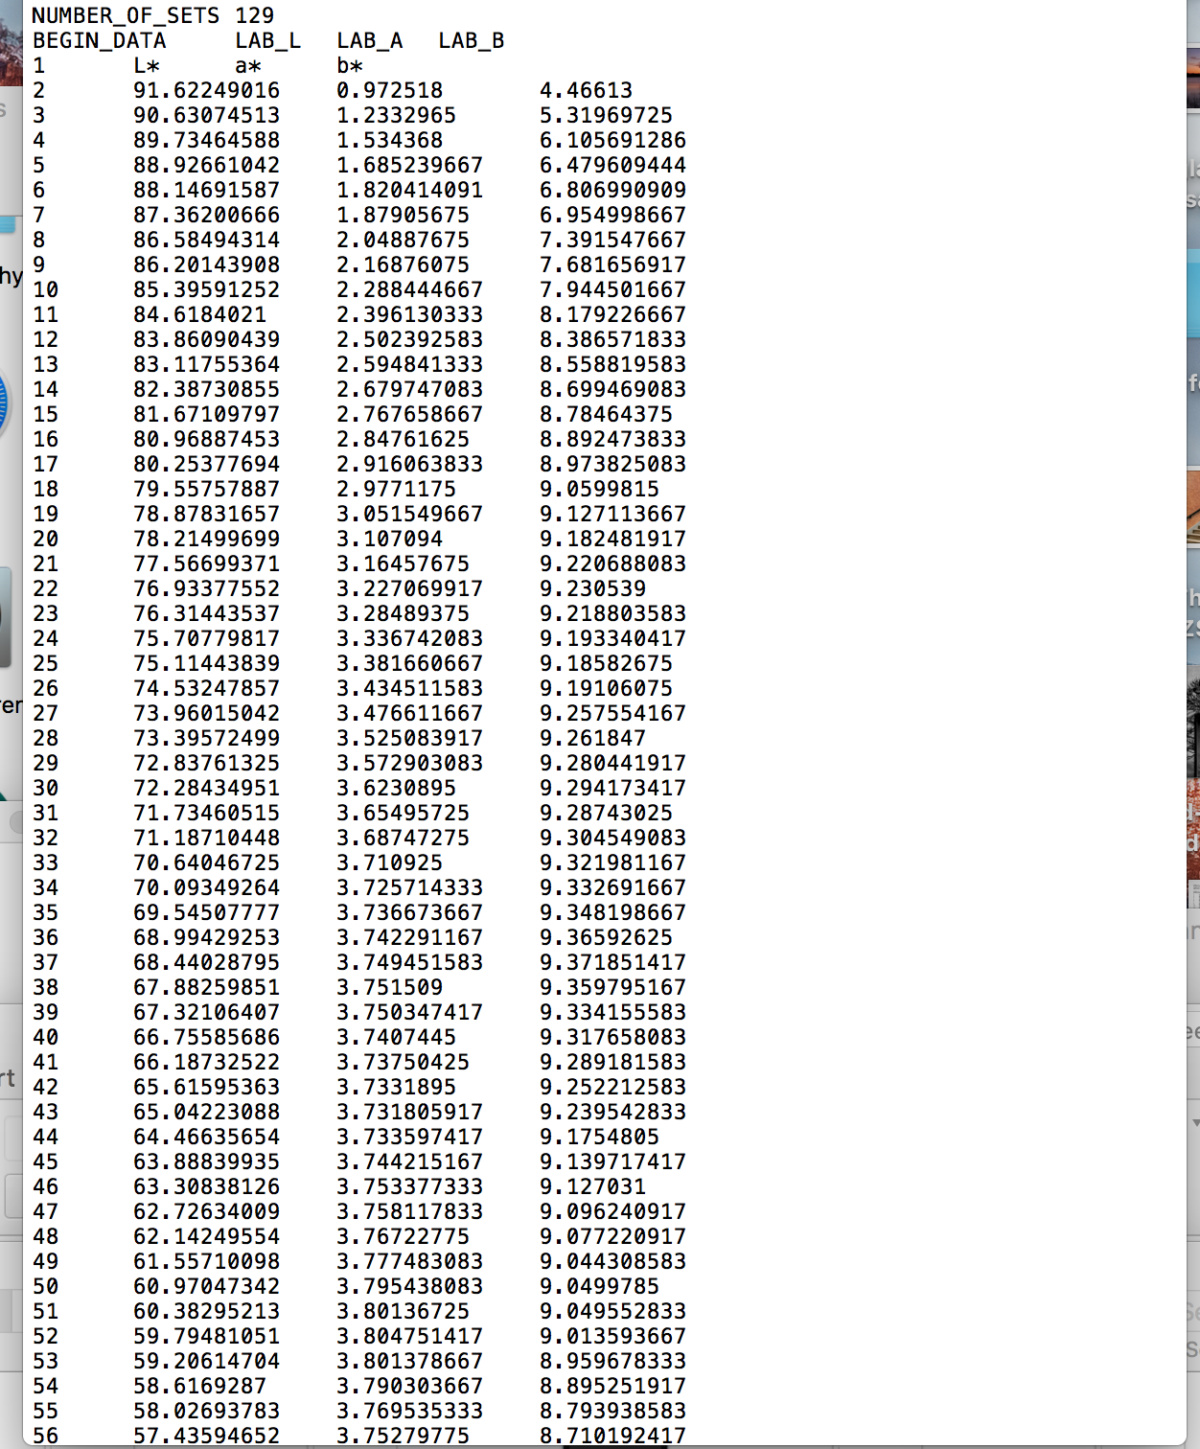
You simply select the Lab values (the 129 numbers under Lab_L) and copy/paste them into the right place in the PiezoDN Smoother Tool.
cheers,
Walker
You are trying to paste more than 129 rows or you are copying and pasting into the wrong row.
Really all you need is the L* values.
But just copy the 129 numbers and paste them by clicking the top left L* (in green) and then pasting.
-Walker
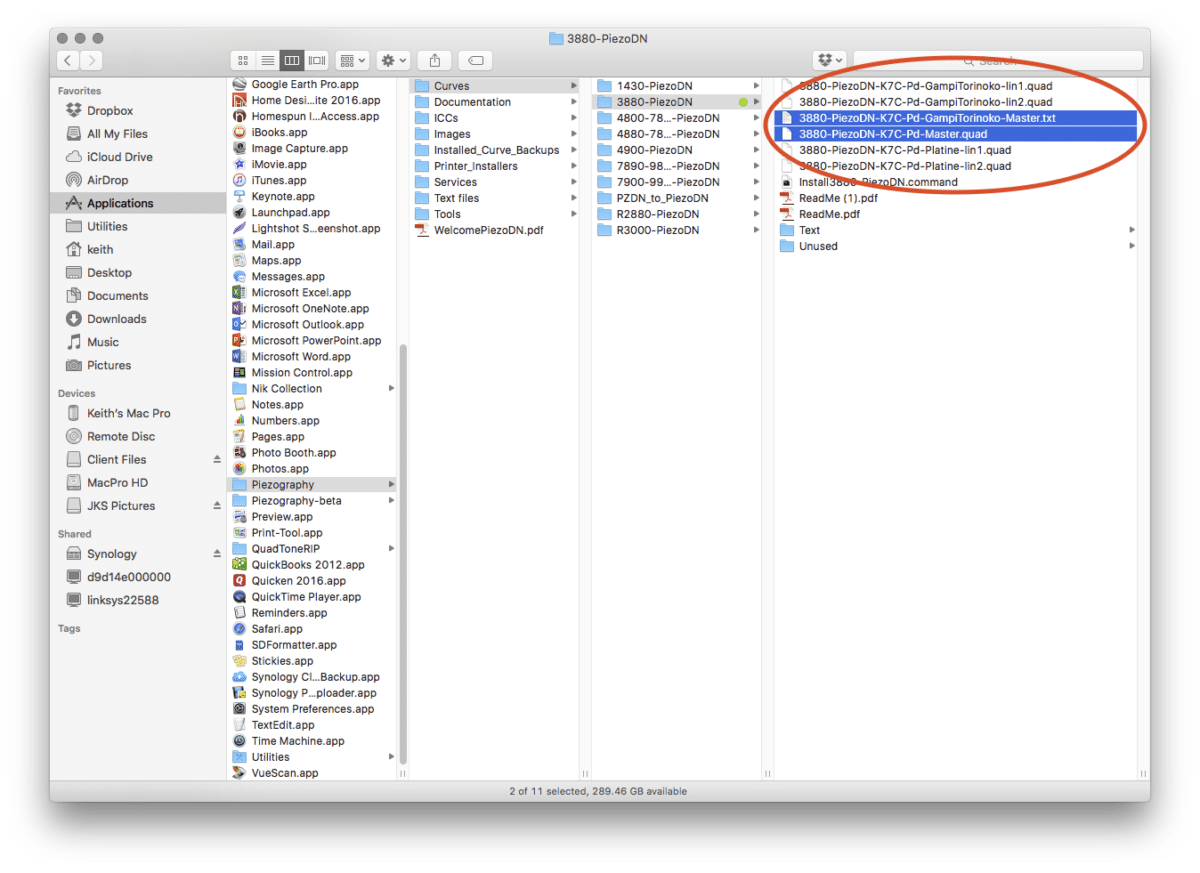
[attachment file=1411]
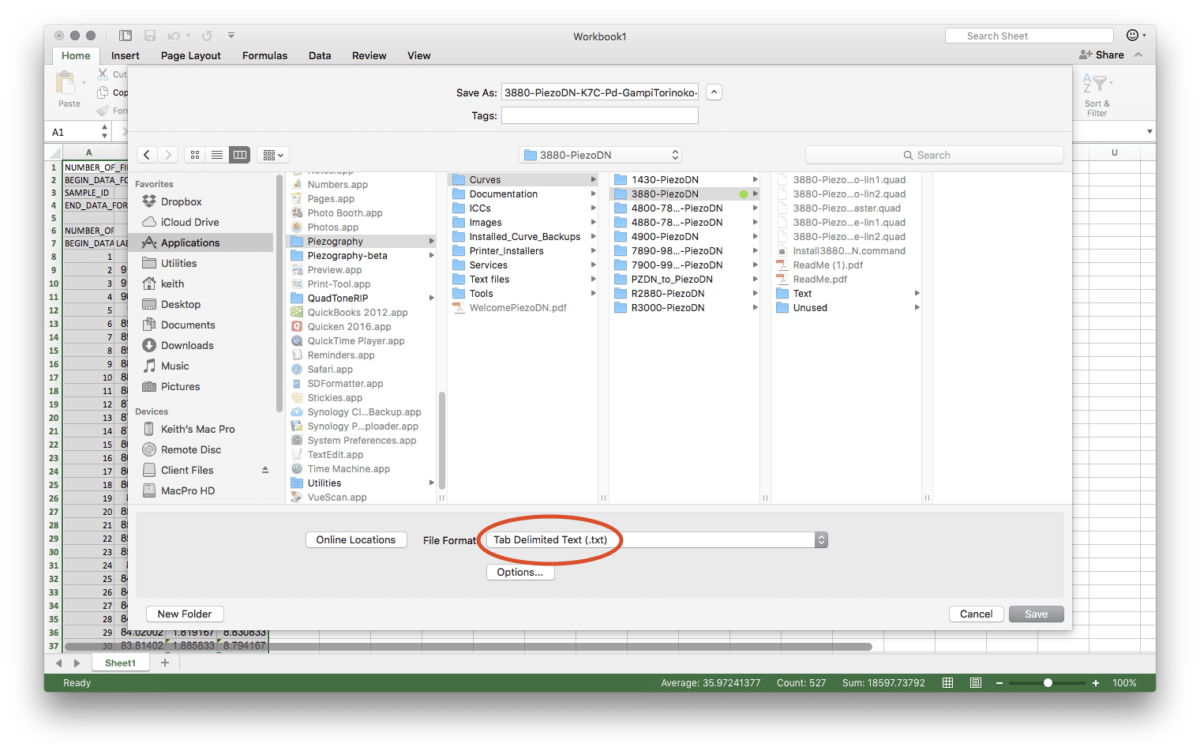
Save this as a tab delimited text file. I save it to the Curves folder, run the QTR-Linearize-Quad app, and then move the text file to a sub-folder I created called Text in case I need it again later.[attachment file=1412]
Now select the Master quad the you started with (or whatever quad you started with) and the text file you just made, and drag them to the QTR-Linearize-Quad droplet in Applications/QuadToneRIP; or right-click the 2 selected files, click Open With …, Other, Applications, QuadToneRIP, QTR-Linearize-Quad.
A new quad with -lin appended to the name should now appear in the Curves folder. (There will also be a new text file with -out appended to the name. This file can be moved to the trash.)
Move your text file to another folder, then run the install command to install your new linearized file.
Now repeat the whole procedure to verify that the linearization worked. If necessary, perform a second linearization. Once you are satisfied with the linearization, you might want to make an ICC profile.
Note: Text files left in the Curves folder can cause problems when you run the install command. Be sure not to leave them there.
Hope I didn’t leave anything out! ![]()
I thought I posted the screen shots last night but they did not show up.
I will try again.
Catherine
[attachment file=1428]
[attachment file=1429]
[attachment file=1430]
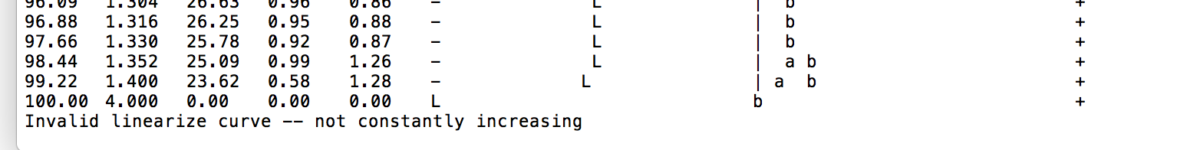
There are no zeros in the other files. The zeros are only found in the out.txt file.
Does that mean something?
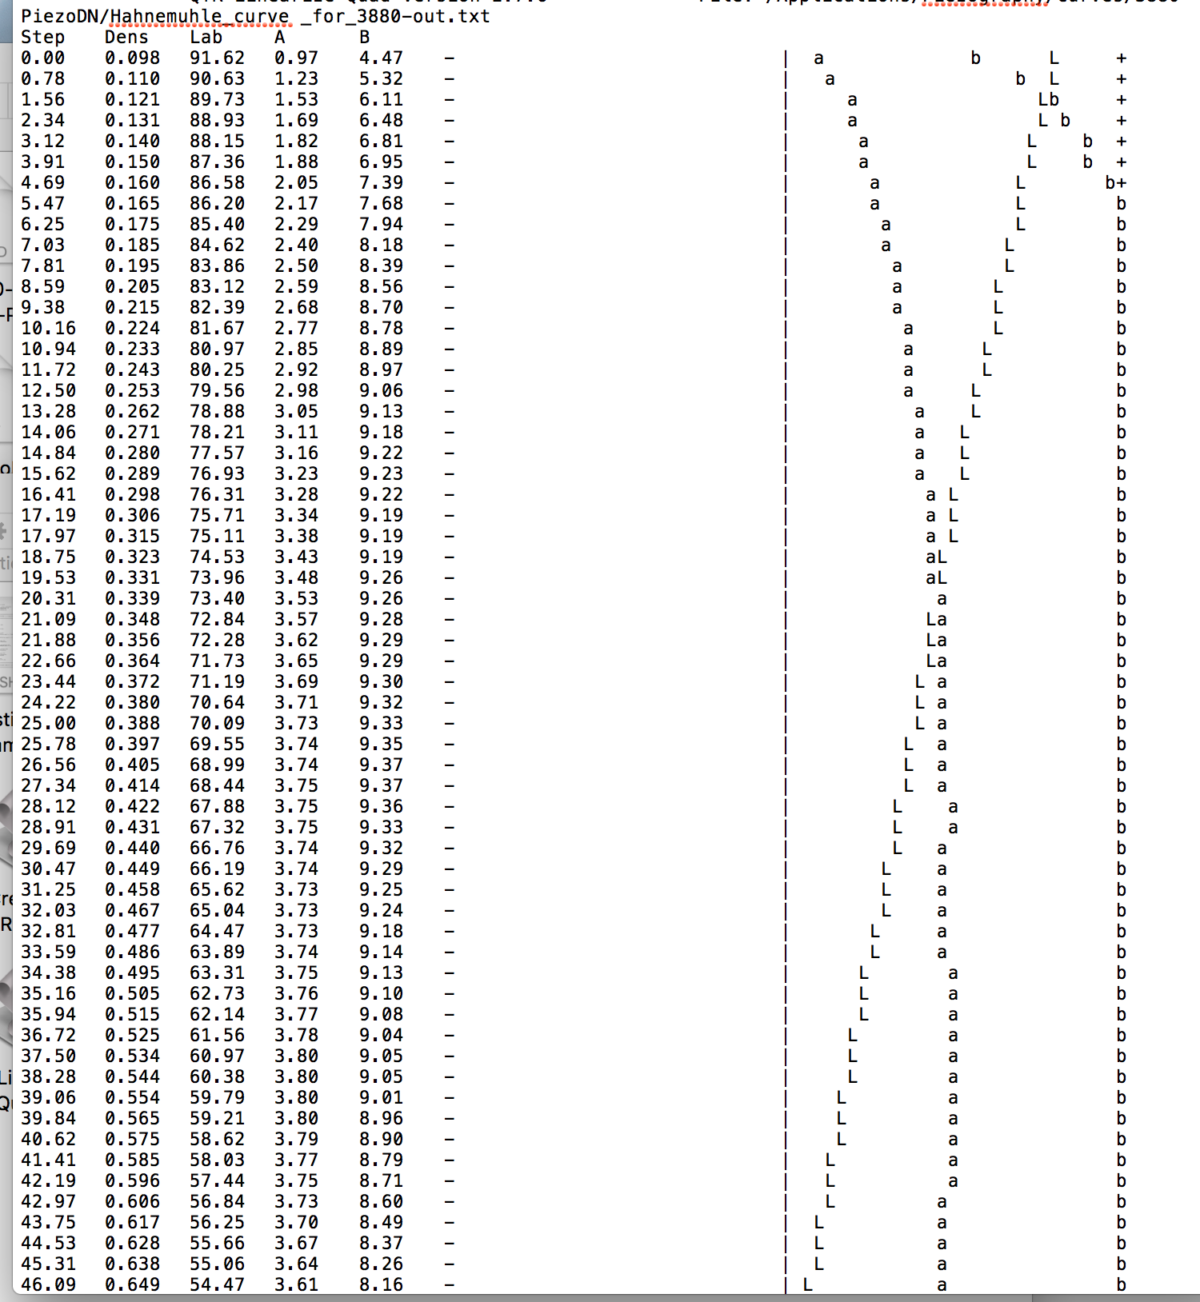
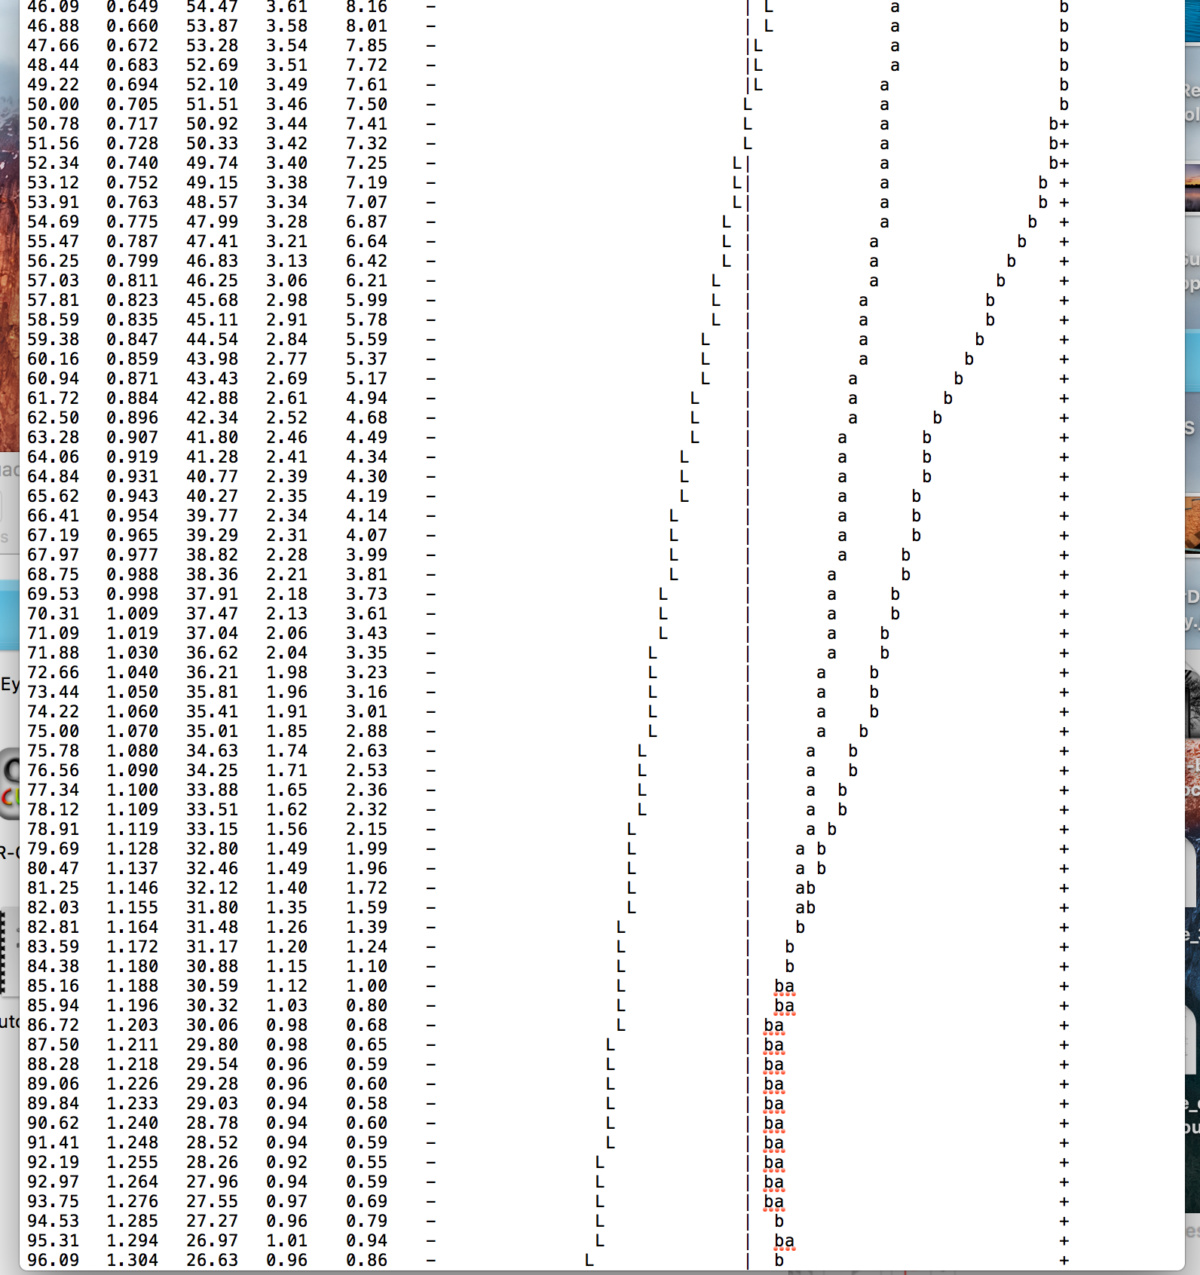
Here is the txt file before I tried to linearize.
Catherine
[attachment file=1434]
[attachment file=1435]
[attachment file=1436]
![]()
I do not know what just happened. One screen shot did not post correctly. Here it is again.
[attachment file=1439]
Catherine
Yes. Please attach the .txt file.
Last night I decided to start over and remeasure the patches. Now the Colormunki will not work. My laptop will not recognize the device and I think something is wrong with the connection. When I plug the usb cord into the colormunki I see a flash of light on the colormunki but that is all.So now I will have to send it in to be fixed and I cannot go any further. The screenshot I posted last night is the CGATS page.
I will try to post the .txt file. Sorry but I need instructions on how to do that. Boy, I am a real case! I do want to learn how to do this.
With lots of gratitude! Catherine
hi,Keith,I have a spyderprint,but i dont know how to use it to read the 129 target,then save as .txt.could you give me some reference,it would be better to have some pictures about this process.thank you very much!
There is no reference with SpyderPrint.
Simply go to Tools>Measure and measure you values (in order from light to dark) and “Export for QTR”
Tobie (at DataColor when SpyderPrint was made) was a fan of Roy’s work.
We’ll be adding screenshots when we have an ounce of time.
best,
Walker
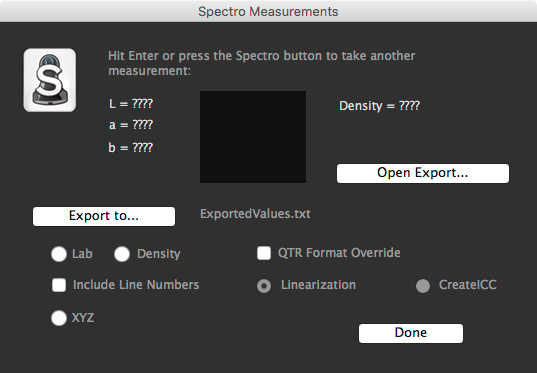
Ha! It’s not quite as simple as Walker suggests. You do skip all of the guided steps, but before you can access Measure on the tools menu you have to Calibrate. Go to Tools>Calibrate (Command+K), make sure the Spyder is in it’s cradle and either push the button on the the Spyder or hit Return/Enter, then click OK. Now you can go to Tools>Measure (Command+M). Here’s where it gets a little less than straightforward. First you need to select Open Export …. This opens a Finder window showing a deeply buried folder where SpyderPrint saves data. (The full path, in case you ever need to find it without going through the app, is [username]/Library/Preferenced/Datacolor/SpyderPrint/Data/Export.) Then go back to the SpyderPrint window and select Export to …, it opens with ExportedValues.txt as a filename - change this to something meaningful like 1430PiezoDN-Pd-Master, and click OK. Unless something else is checked, LAB is the default reading so you don’t actually have to select it here, but it’s ok to do so if you want. Just be sure nothing else is checked. To make your readings, begin at the lightest patch, set the sensor in the middle of the patch and push the button on the sensor (or push Return/Enter on your keyboard). Read each patch in order from lightest to darkest, then click Done. The readings are saved as a .txt file in the above referenced folder. There is one row for each reading in the format L A B. Open the file, select all (Command+A), copy to clipboard (Command+C), go to the Curve tab in the Smoother tool, right-click the top left cell of the green section, and select Paste. (Note: It is not necessary to select the entire range.) Make sure that the first and last L readings are in fact the lightest and darkest. Follow the instructions on the page.
I think I’ll write this up in more detail with illustrations and post it on my website. I’ll post a link here in the forum under a new topic so others can find it.
[attachment file=25927]
Thanks Keith.
Man, I wish there were more minutes in the day.
-Walker
hi Keith Schreiber, That’s very kind of you! fully expect to see your illustrations!