The only time you should see the read-only warning is if you try to save the page. Do you mean that you are seeing it when you copy/paste into it?
I’m going to try to walk you through this with screenshots. Maybe that will help to figure out what you are doing wrong. I am using a SpyderPrint3 set on LAB with QTR formatting off to make my readings. Including line numbers is an option, but I am not using it. This produces a simple text file of 3 columns separated by tabs.
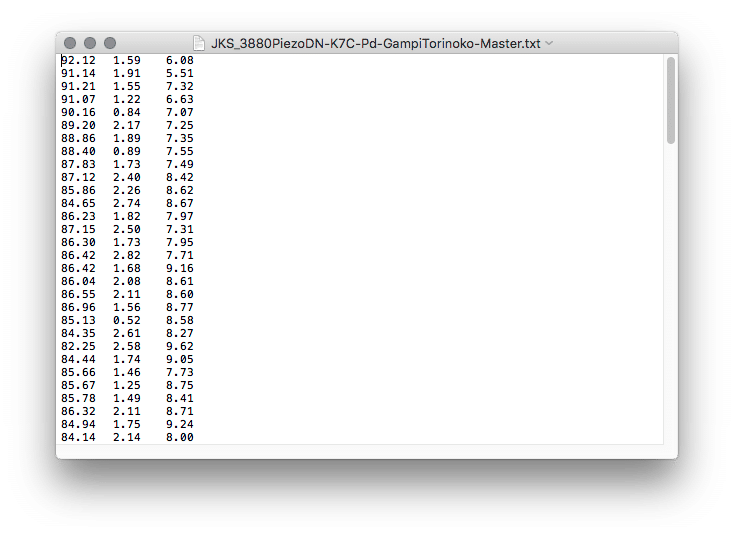
Here is what the text file direct from SpyderPrint looks like. [attachment file=1404]
Select all on the keyboard by hitting command-A or click Select All from the Edit menu. Then copy via command-C or Edit>Copy.
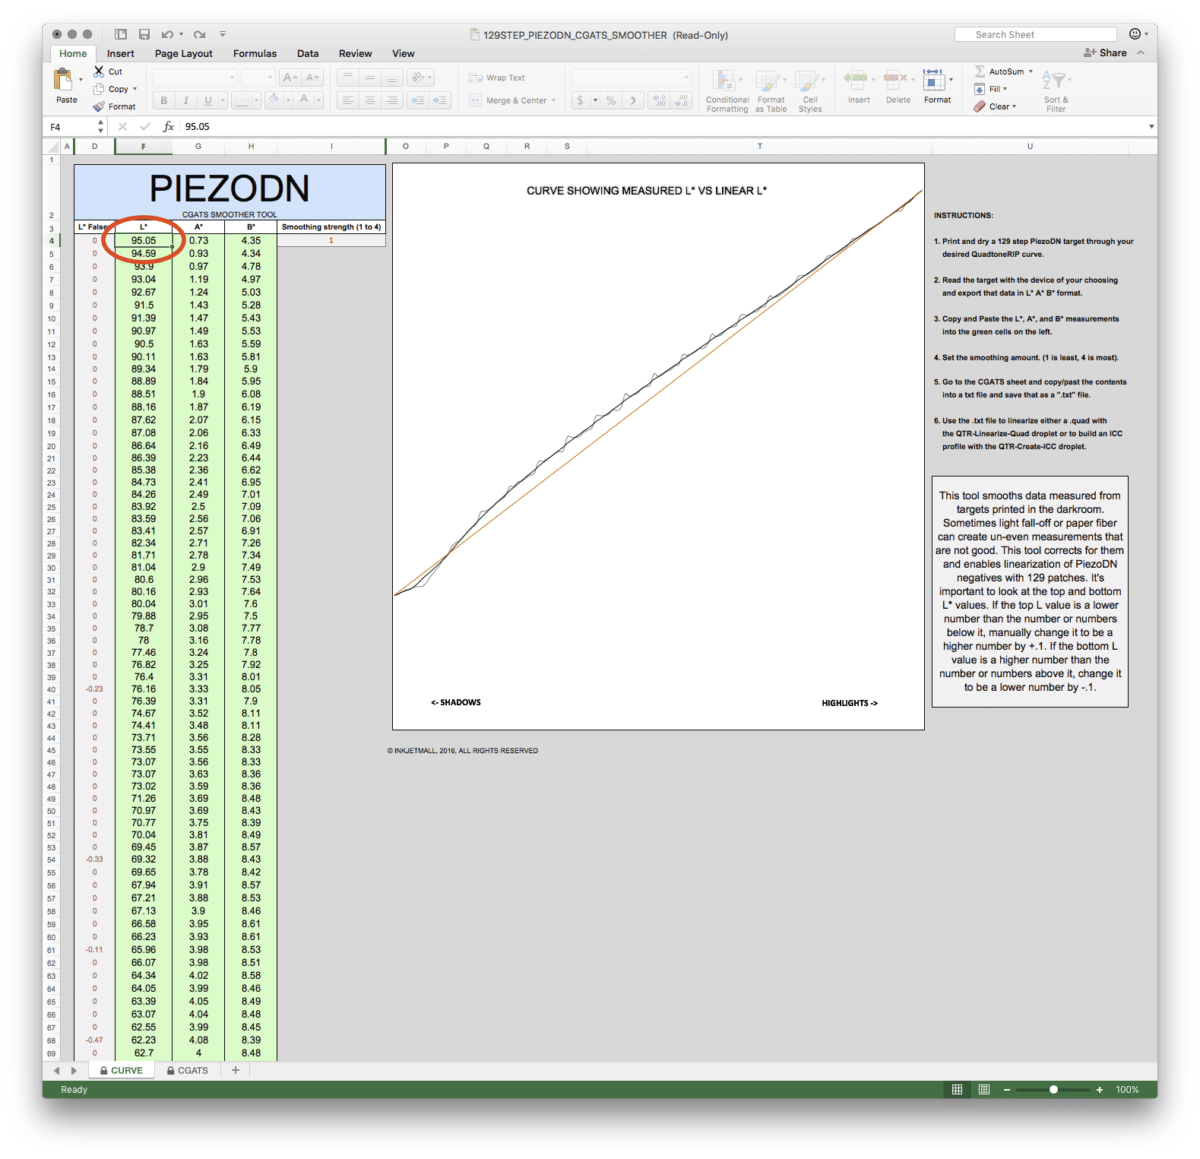
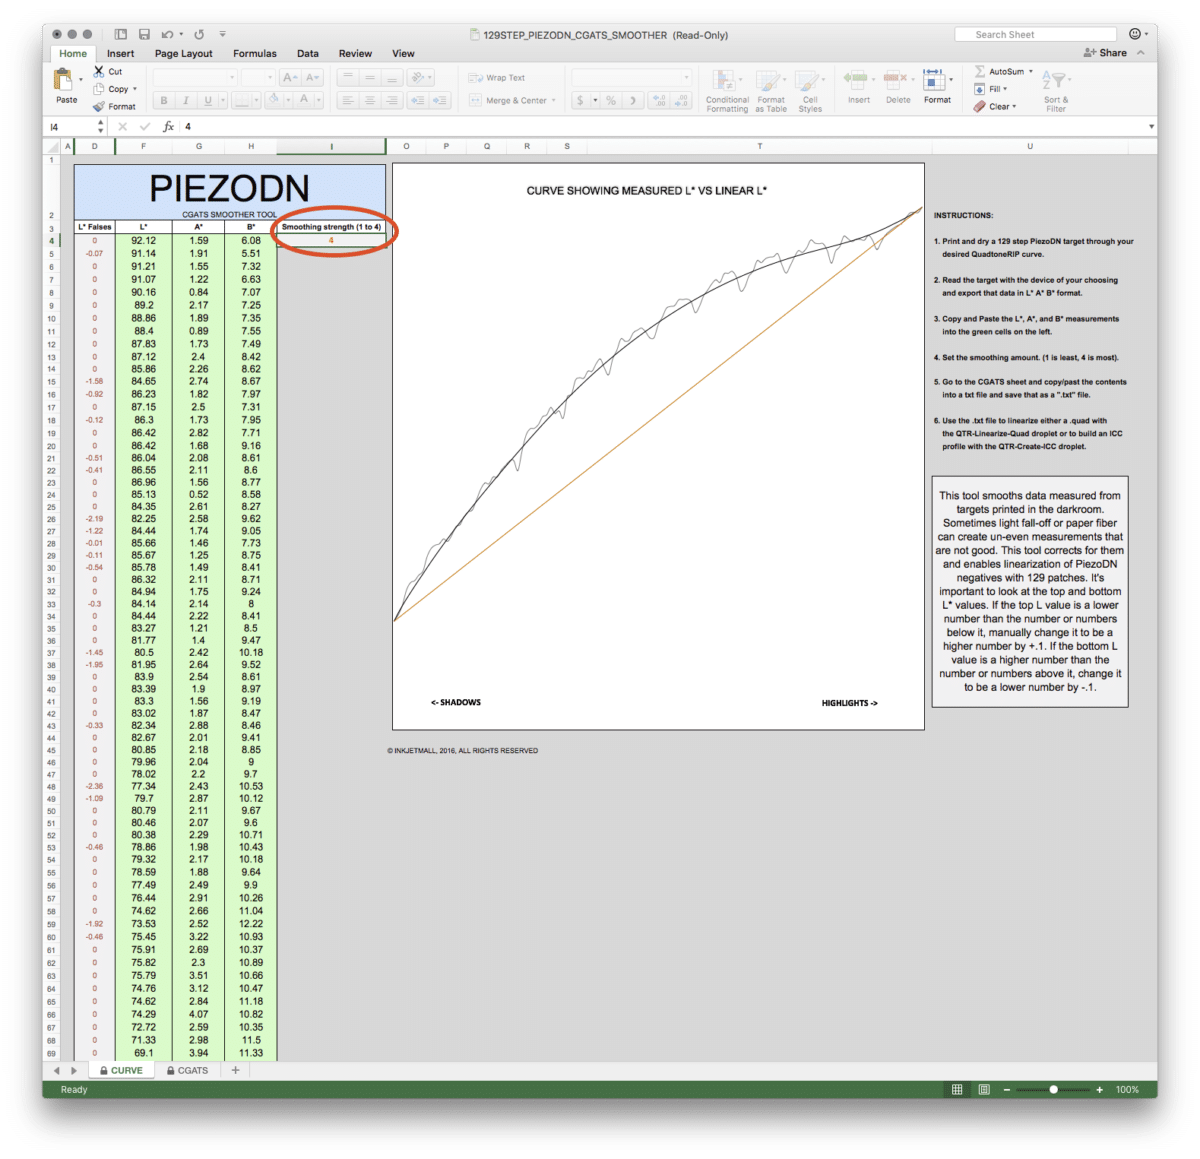
Now go to the Smoother Tool. On the Curves page, click on the first cell of the L* column.[attachment file=1405]
Paste the data in by hitting command-V or clicking Edit>Paste.[attachment file=“1406”]
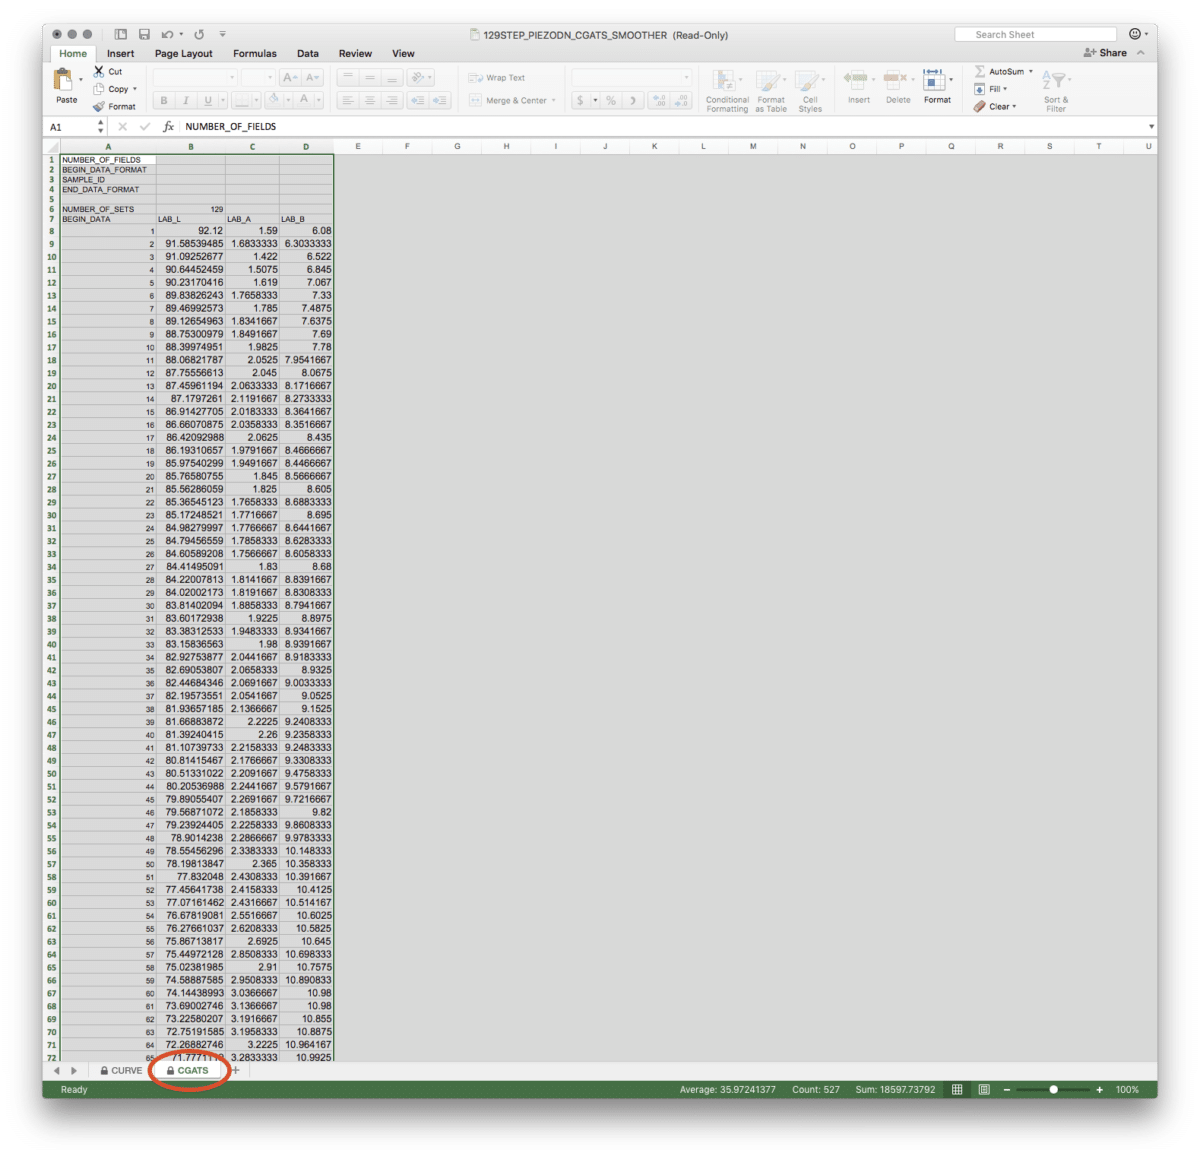
Now click on the CGATS page in the Smoother tool. The data should already be selected.[attachment file=1407]
Copy this, open a new workbook in Excel, select the top left cell, and paste it in.
Looks like thats all the images I can put in one post so I’ll have to continue in another.
One more note. The paper I was profiling here is called Gampi Torinoko. It has a lot of texture and variation in fiber which is why the variations in the readings are so extreme. This is very unusual. Most papers will show some “reversals” from coating and exposure inconsistencies, but not nearly to this degree. Don’t worry - that is what the Smoother is for! As long as the first and last numbers are ok, don’t worry about the falses unless something is an obvious error. Just let the Smoother do it’s job. Thanks again to Walker for adding the higher levels of smoothing.
About the A* and B* columns, they are not used in linearizing the quad, but if you make an ICC profile and use it for soft-proofing, they are used to show the hue of an actual print remarkably well.
Keith, thanks so much! I followed your instructions which really helped. I noticed that the numbers in the CGATS page are different than in the curves page. Is that correct?
I dragged the two files to the QTR-Linearize-Quad and got an out.txt file but no -lin quad file.
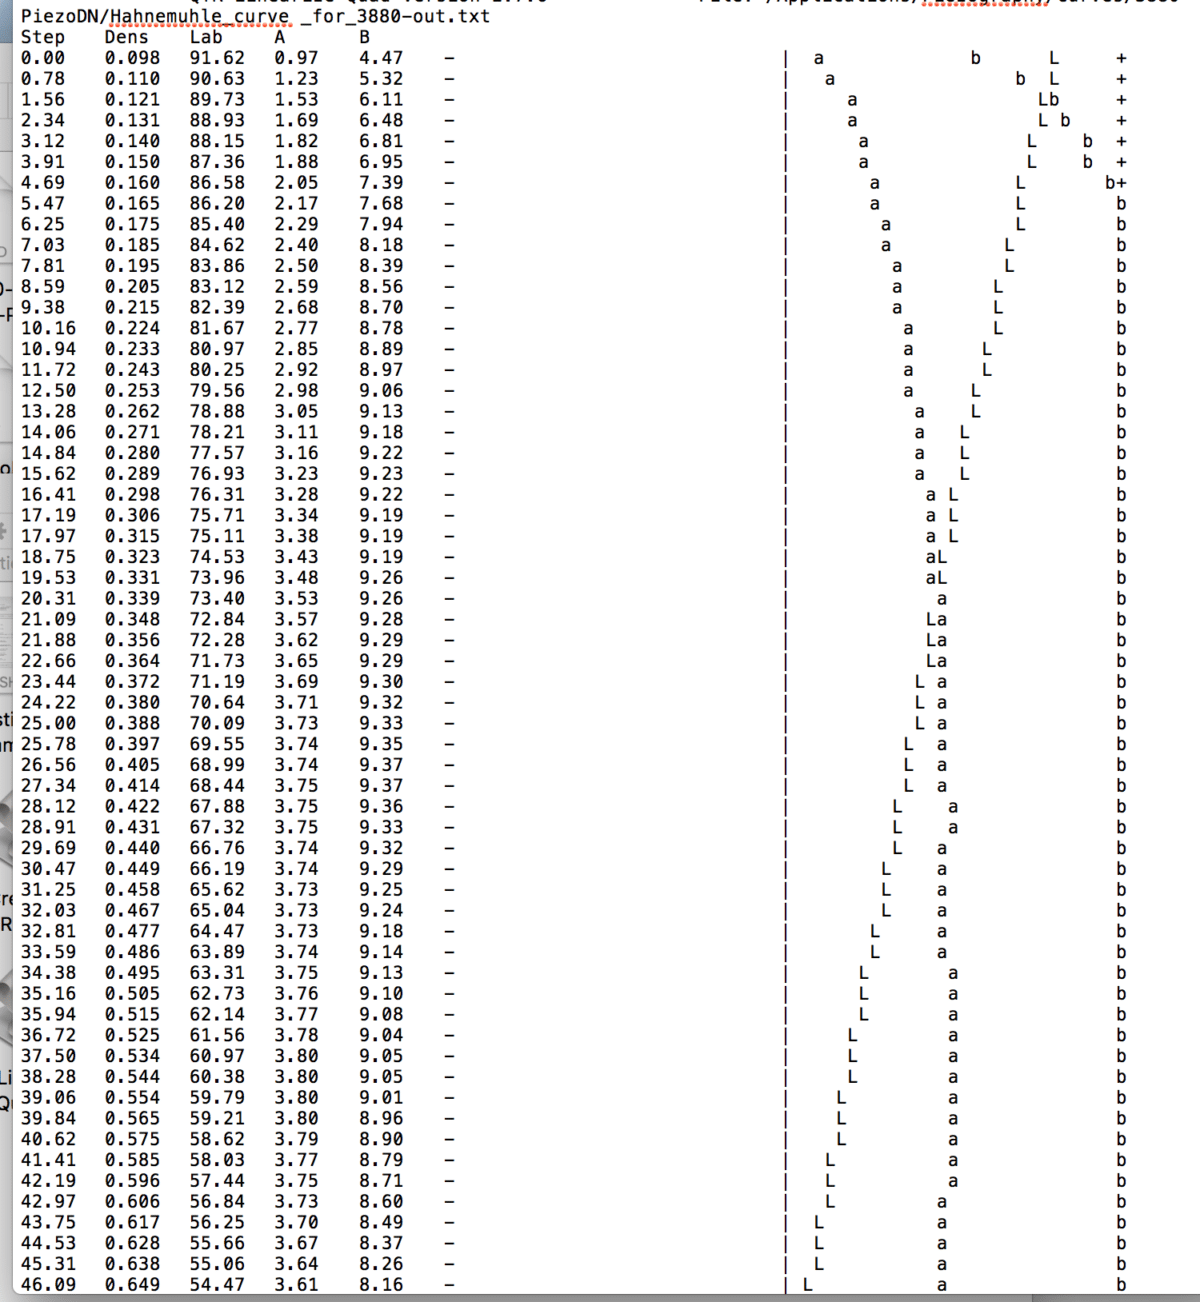
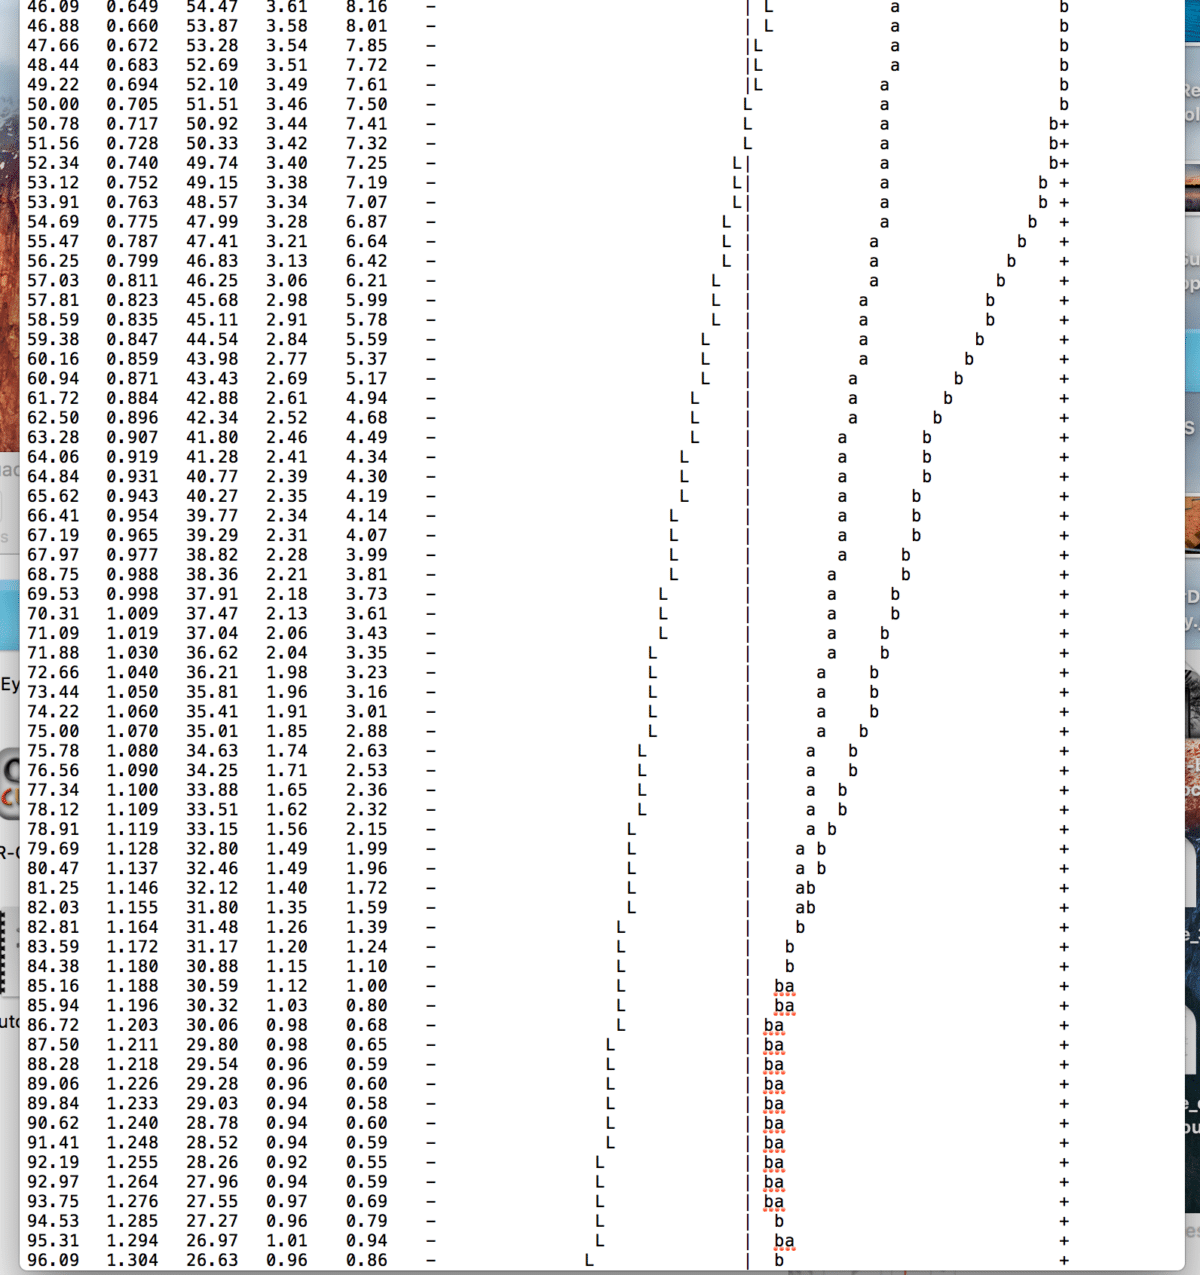
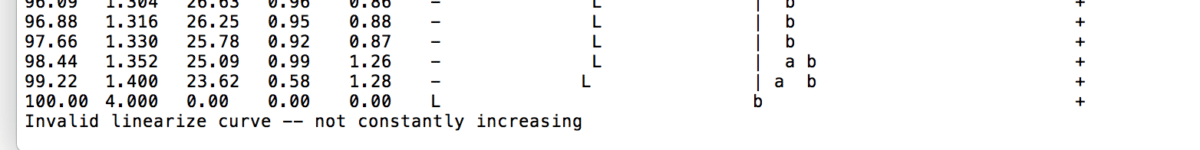
At the bottom of the 0ut.txt file it says “invalid linearize curve – not constantly increasing”. I am posting screenshots.
What do I do about that?
Thanks, again.
Catherine
[attachment file=“Screen Shot 2016-09-15 at 8.42.08 PM.png”]
[attachment file=“Screen Shot 2016-09-15 at 8.45.08 PM.png”]
[attachment file=“Screen Shot 2016-09-15 at 8.46.09 PM.png”]
The numbers on the Curves page are what you pasted in. The numbers on the CGATS page are the smoothed linearization produced by Walker’s magical spreadsheet.
Are you sure the first and last numbers are good? You shouldn’t have to manually adjust anything else. Can you attach the -out.txt file?
Walker, I messed with csv-s, and after some Google search, I came to solution (again): you need to import csv into Excel and not open it. Then it manages to make a perfect table (at least that is for Excel for Mac 2010).
Marko
I thought I posted the screen shots last night but they did not show up.
I will try again.
Catherine
[attachment file=1423]
[attachment file=1424]
[attachment file=1425]
It’s in the next to last line, just above the “Invalid linearize …” message. The LAB values all read 0.00. This could mean that you skipped a patch somewhere, or that the final reading was bad. (It is odd that it has a Density reading of 4.0.)
The simple way to fix it, without having to do the readings over, is open the text file that you made when you copied/pasted the CGATS data to a new tab delimited text file and manually enter values to replace the zeroes. The A and B values don’t really matter, so I’d leave those the same as those just above, but the L value must be lower than the one above it, so enter 23.50 or something like that.
I’d also be curious to try to trace the source of this error. You should be able to find it in the Smoother tool at the bottom of the Curve page. I bet the last value is missing there.
I thinks it’s a good practice to always identify your screenshots. Rename them to something meaningful, or caption them or something. 
This looks like the CGATS page. Or is it the test file you made from the CGATS page? Or is it the test file from you ColorMunki? My guess is the last. There should be data in line 1, not L*, A*, B*. Maybe that is the missing measurement. I don’t know the i1 software so I can’t help there, but you are ending up with 128 lines of data rather than 129. My guess would be that you are missing either the first or last measurement, but I have no idea why. Maybe if there is a way to make manual readings you can figure out which is missing. Check the first and last patches. If it is clear that one of these is missing, then insert it at the appropriate point. If it is the first patch, it will simply replace the L* A* B* line. If it is the last patch, it will go at the end, but you will also need to delete the L* A* B* in line 1, and shift the data up one row. This is easy in a spreadsheet, not so much in a text file. If it is a text file, copy it all to a new worksheet in Excel, make the necessary modification, then save as tab delimited text.
Sorry this is taking so long to figure out, but don’t worry, we will get there.
Catherine,
I just looked through this whole thread again and noticed a couple of things I missed earlier. There is something really wacky going on with the fluctuations on the shadow end of your 129-step as seen in the graph on page 1. And also missing data on line 129 was there earlier too. I think the best way to resolve this is to start from the beginning rather than trying to work backwards as we have been mostly doing.
Could you please attach the txt file produced by you ColorMunki software. I mean the file itself, not a screenshot of it.
Text files are attached the same way as image files. Click Select File in the Attachments area. Navigate to the file on your computer. Click Choose.
I may not have been clear enough about the 2 pages in the Smoother Tool. The Curve page is where you input your LAB data from your ColorMunki. Make sure you have 129 lines of data - LAB values, nothing else. If the line 1 contains L* A* B*, something is wrong with what you have copied/pasted. Make sure the first number is the highest, and the last number is the lowest. Edit them if necessary. The rest you can leave alone unless there is something that is a gross error, such as might happen if your sensor was not in full contact with the paper. (I’ve done this!) The Smoother will take care of the normal wobbles. The CGATS page is the output data that the Smoother has created. You do not enter or edit anything on this page. You will only copy it to a new Excel file which you will save as tab delimited text. If this file does not have 129 lines of LAB data, something went wrong earlier in the process.
[attachment file=1456]
OK. Hope it worked!
My first number in the curves file starts with line 5 and ends on 133. That would not be 129 lines so I may have missed something.
The CGATS starts on line 9 and ends on line 137. That is 129 lines, right?
Catherine
Hahnemuhle_3800_CGATS.pdf (21 KB)
That worked but it’s the wrong file and the wrong format. We are looking for the file that was created by your i1 ColorMunki software, the one that you are supposed to copy and paste into the Curve page of the Smoother, NOT the CGATS page, and it should be a .txt file, not pdf or any other format. When you open it, it should open in TextEdit. Why do you even have a pdf file?
In my SpyderPrint software, there is a somewhat hidden (or at least well buried) folder where these files are kept. Maybe there is something similar in yours. In the ColorMunki dialog when you make your readings is there not something about where to save the resulting file?
I am sorry. I just misunderstood. Here is the .txt file that I created from the .csv file that Colormunki created.
I saved it on the desktop.
[attachment file=1464]
ColorMunki.txt (3.62 KB)
Looking at the ColorMunki txt file it looks like you do need to change the last few numbers manually as the instructions say.
I did see a direct typing permissions bug in the Smoother tool excel file when doing this. Not sure how it that happened. Regardless, I fixed the bug and updated PiezoDN to 1.9 (it’s available in the Downloads section).
However, the 1.8 version still lets you copy and past the 129 number so feel free to correct the last few numbers manually and then just copy and past them into the smoother tool. I did a successful linearization at strength of 2.
best,
Walker
In fact. It’s possible do to this without any manual correction and a strength of 2. (see attached screenshot)
[attachment file=1472]
Walker, you and Keith are real jewels! I tried to post the Colormunki .txt file into the first page of the smoother tool but I get the same message, " This chart is protected and is read only." I select the numbers in the .txt file, copy and then try to paste in the smoother tool. That is not exactly hard to do. 
I downloaded version 1.9 and noticed now there are instructions for Colormunki. Also mention is made of the Piezography Error Corrector link (Google docs). Can you send that to me by email? Maybe that will help.
Thanks for the updates that you are creating.
Much appreciation, Catherine
Try opening the txt file in excel and selecting just the L* numbers.
The txt file contains more than three columns of data so you will be getting that error if you don’t do what Keith and I have been describing. This is also talked about in the new ColorMunki instructions in the new manual.
best,
Walker
It has an extra column AND an extra row. I counted 129 rows of numbers plus the column headings. There may be a setting in your ColorMunki software to turn those off. But try Walker’s suggestion. Open it in (or copy it to) Excel the select ONLY the 129 rows and 3 columns of numbers. Try copying that to the Smoother.
Something else to be aware of when copying/pasting In Excel is that if you right click when pasting and then select Paste Special …, you can then select Values so that it won’t paste any unwanted or unnecessary formatting, formulas, etc. - just the values.
Believe it or not! Catherine finally got a lin.quad file tonight after working on it for 2 hours! I am not even sure how I did it.I kept trying different methods- Excel, Google sheets, etc. At one point Excel kept crashing every time I tried to open the smoother file. So I downloaded the program again.
I wish I could go to the next step but my ColorMunki is not working. I have started to work with Xrite to fix it but I do not think this will be quickly done.
Thanks for all your help. I will probably be back with more questions but for now there will be one less problem for you to solve!
Catherine
Congrats! Now make a new 129-step negative using that curve. Print it in the darkroom using exactly the same chemistry and procedures you used the when you printed the Master. You should see a visible difference between the 2 prints. The next step would be to read the print with your ColorMunki and enter the data into the Smoother to verify linearity. If it is now linear, you are ready to print images, or make an ICC profile if you want. If it is not quite linear yet, which in my experience is the case more often than not, you repeat the process a second time but using the first -lin curve rather than the Master. If you are going to be stuck without your ColorMunki for a while, I’d be happy to do the readings for you if you’d like, but you would have to send me the print.