I am trying to drag the .txt file and .quad file into the QTR- Linearize- Quad droplet without success.
Following the instructions I moved the .txt file (file with the Lab* data) into the same location as the .quad that I used to print the 129 step target. This was the 3880-PiezoDN-Pd-Ox-IJM.quad. Then I selected both files and
dragged them together over the QTR-Linearize-Quad droplet. Nothing happens that I can see. I do not see a file with “-lin” at the end.
I must be doing something wrong. Thanks so much for your help.
Dragging the 2 files together and dropping them onto the droplet can be a little awkward. I confess that a few times when I’ve done this I’ve missed the target. Other times it took a moment before I saw the new -lin file, though it was there. First a question: Do you see a file with -out at the end of the name? It should actually be open in TextEdit, as well as be added to the file list in the curves folder. Another question: Did you put the text file in the curves folder or vice versa? You should be looking in the curves folder for the new -lin file.
There is also another way to run the QTR-Linearize-Quad droplet. Highlight both the .quad and the .txt files, right click (or Option Click) on them, go to Open with … and navigate to and select QTR-Linearize-Quad. Voila!
If none of this works, there may be something wrong with your .txt file. Maybe post it, or a screenshot of it, here.
You may need to drag both files to the desktop to do the lin.
On some versions of OS X are some permission restrictions (for security reasons) inside of the >Curves> folders that can disable the Lin from happening there.
Not forgeting while the QTR-Linearize-Quad droplet is in the QTR application the file gets created in the same folder as where the 3880-PiezoDN-Pd-Ox-IJM.quad came from. I open up two finder windows, then drop the two file across.
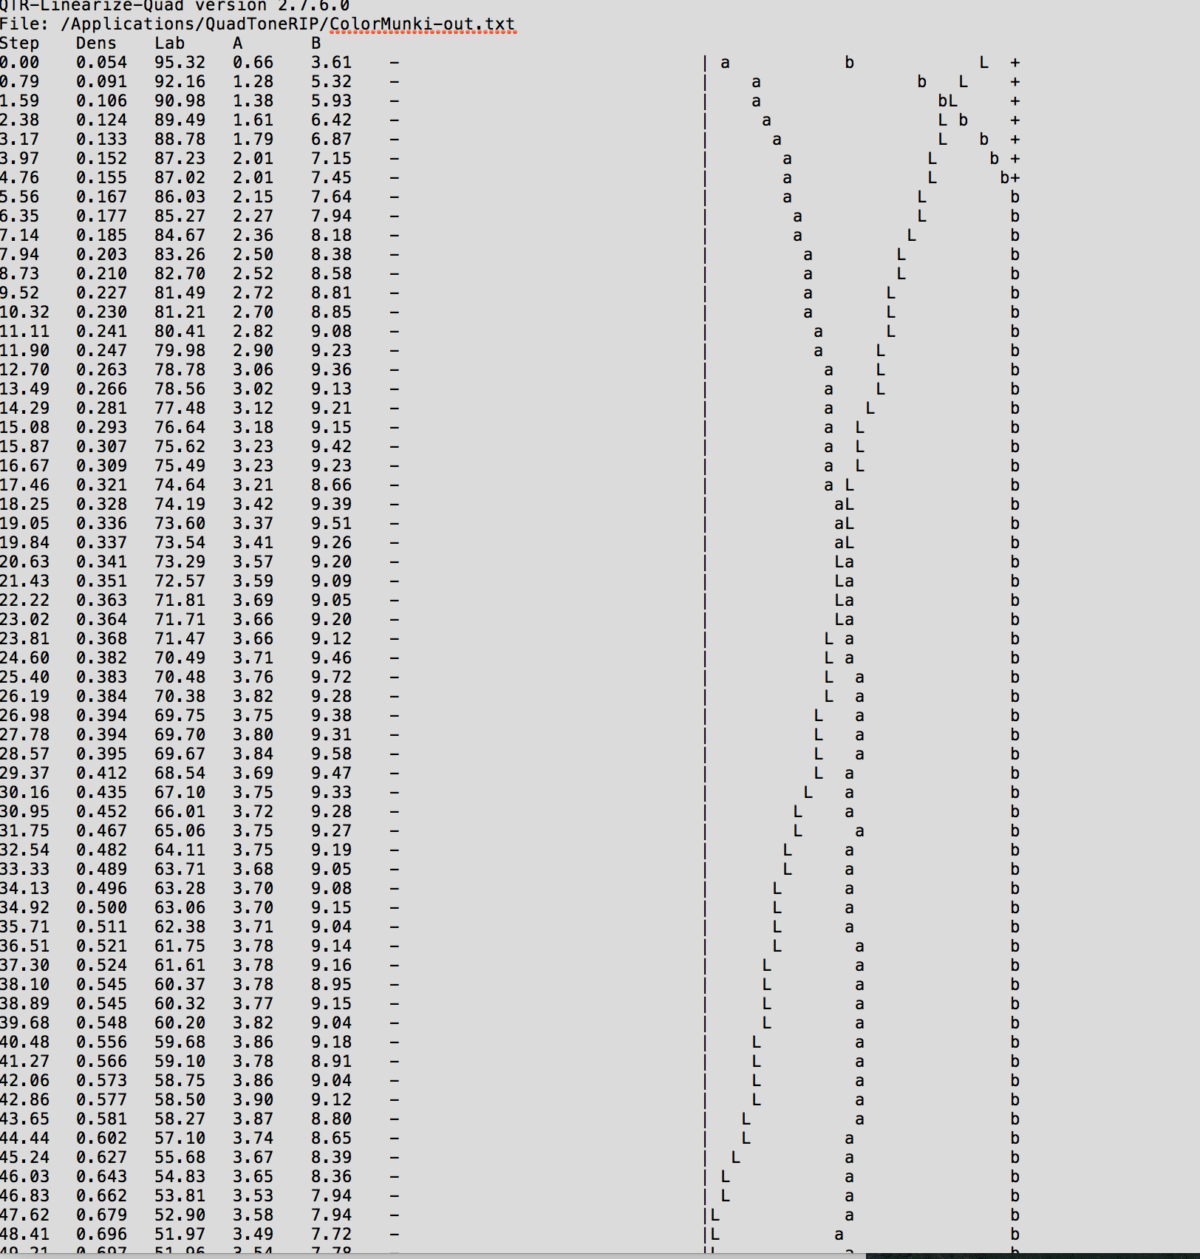
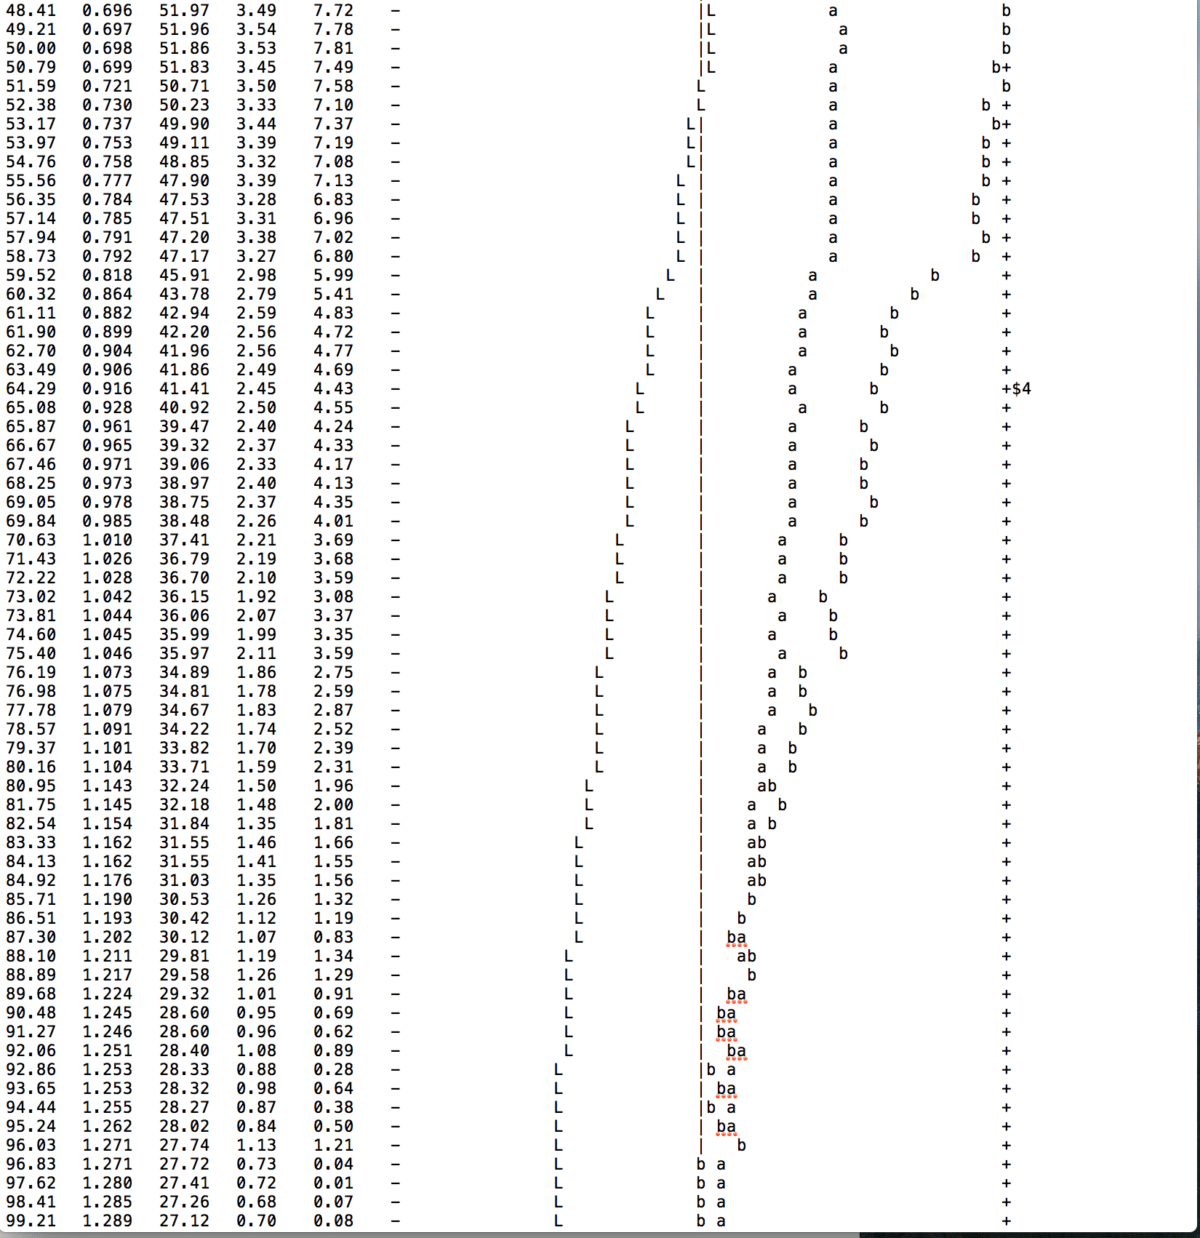
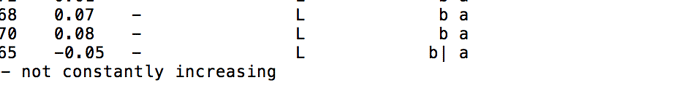
I found the -out text file and there is something wrong but I do not know how to correct it. I will post a screenshot but there will be 3 because I could not take one shot. I hope I do this correctly.
I tried the suggestions for moving the two files to the QTR-Linearize-Quad Droplet but they did not work.
Thanks, Keith, Shane and Walker. Glad you are here to help.
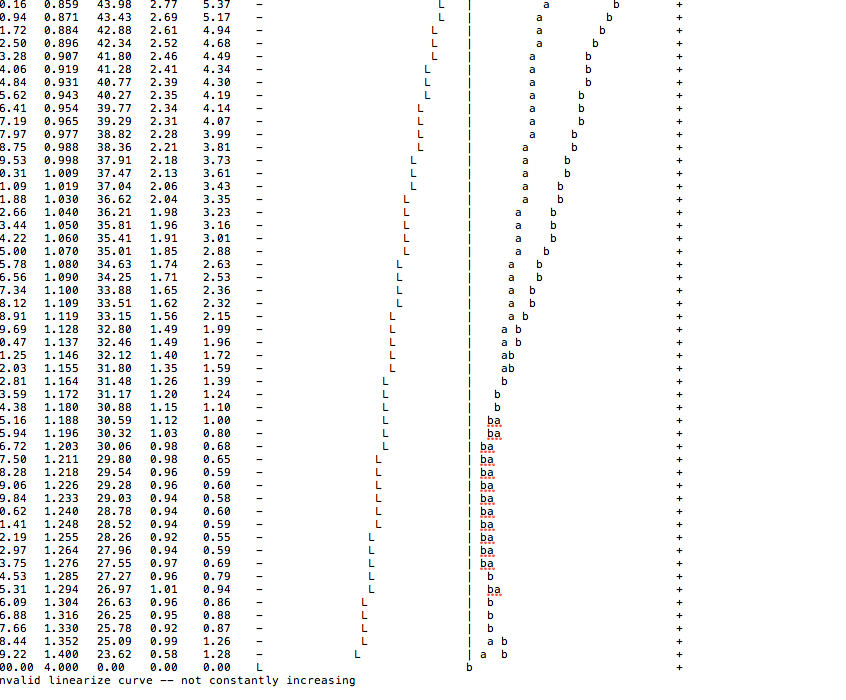
The last line is the clue. And right above that I think is the problem, though since it is not the highest density (lowest L*) the Smoother tool should have fixed it. Look at the last 5 or 6 rows and you will see the reversal. You did generate the text file from the Smoother right? Try increasing the strength setting in the Smoother. The last few I’ve done, I used the maximum setting (4). It makes things go, um, well, smoother!
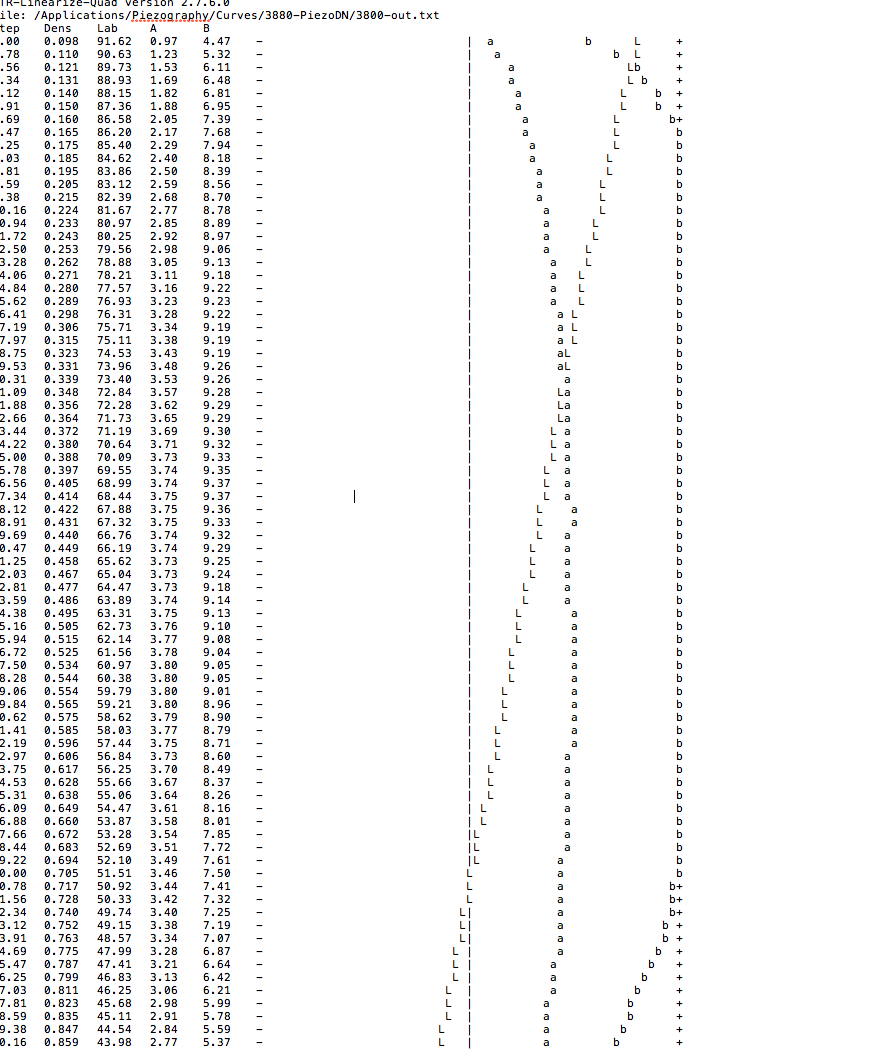
Keith, thanks for your reply. I created a new Cgats text file and tried to change some numbers so I could get a linearized file but I could not drag the two files over the QTR-Linearize-Quad Droplet. I get the same message at the bottom. I am posting the screen shot. Should I be looking at all the numbers or just a certain column or columns?
Can I just change them in the -out txt file?
Thanks for your time. These kinds of steps are always the hardest for me.
Your screenshots cut off the left edge of the .txt window, but one thing that is no right is the last number. Density should be 1.4x, not 4.00. I don’t see any reversals now, but it’s hard to look through that without my eyes hurting!
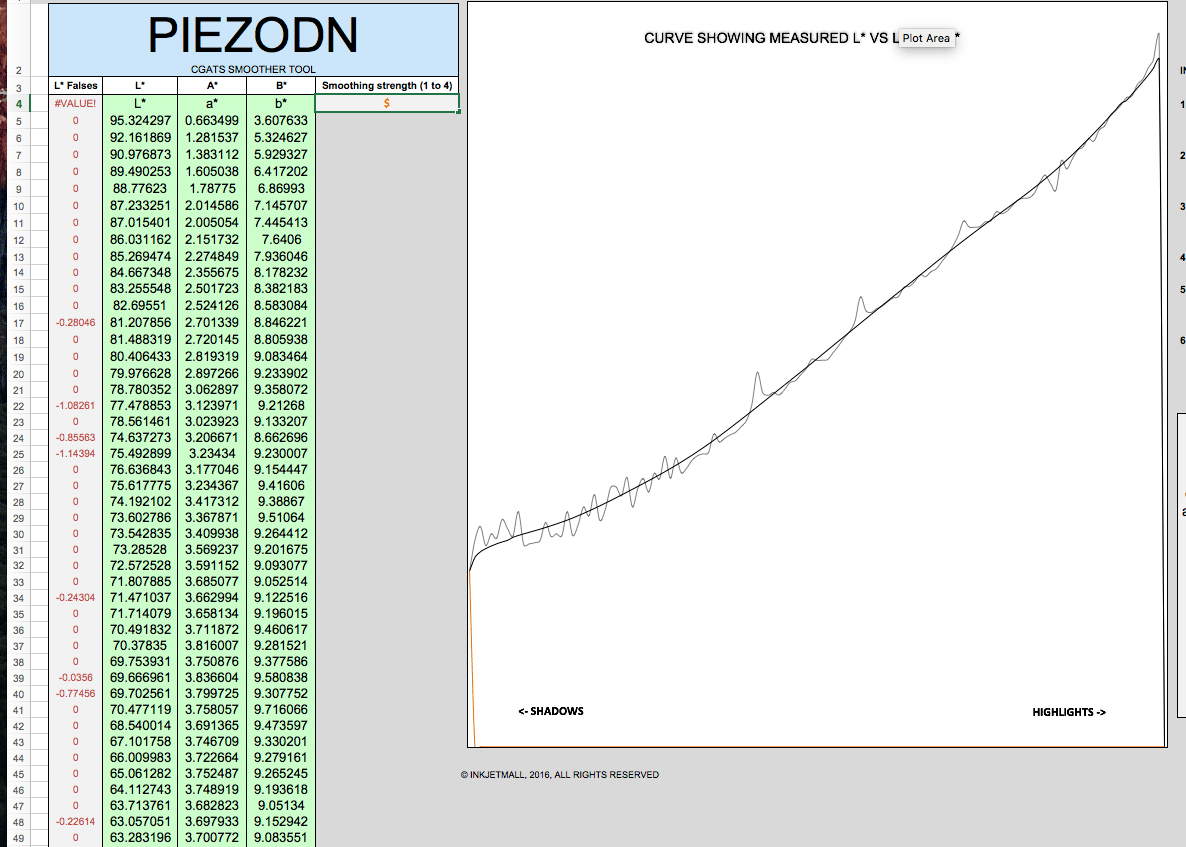
You didn’t answer my question about the Smoother. The left most column on the Curve tab of the Smoother is labeled “L* Falses”. This will alert you to where you have problems that may benefit from a manual correction. However, I have not needed to make manual corrections and I am working with some Japanese papers that are way more variable than the usual papers we use for Pt/Pd and show some pretty dramatic fluctuations through the 129-step.
What paper are you using?
What is the Smoothing Strength set at?
Have you tried a higher setting?
Please post a screen shot of the Smoother Curves page with your numbers pasted in and be sure to include the graph.
Ok Walker, I know you have magic powers and all that, but how did you spot a missing patch? The % column begins with 0 and ends with 100, so it must be somewhere else. For us mortals, line numbers would be very useful here. I think that is an option on my SpyderPrint software. Is it possible with the Munki?
I am using the new Hahnemuhle paper. I set the smoothing strength at 4. I am posting screen shots as you requested. Walker, I think I did measure 129 steps but you will be able to see that on these screen shots.
There seem to be a lot of falses. Is that unusual?
Line 4 should contain actual values rather than L*, a*, and b*, which I think accounts for the steep drop at the extreme right of the graph. THat is your missind reading. Not sure what, if anything, the orange line dropping down and slightly to the right from the extreme left means. Also, in Smoothing Strength, I see a $ rather than a 4. That may have an adverse effect.
My guess is that the extra line of L* a* b* is something that you inadvertently copied over from the text file you pasted into the Smoother. Can you show us the text file from your measurement software (i1, ColorMunki, SpyderPrint, etc) that you pasted in to the Smoother? I’m using SpyderPrint and I’ve found that there are certain options (enabling line numbers, using QTR format, etc) that may or may not be useful here. Why you seem to have only 128 lines of data is another question.
Holy mother of chaos, Batman! That is a real mess. At least, I think, we have found the source of your problem. Is there an option in the software that allows you to save just the LAB numbers in 3 columns, no headings and none of that other data? That is what I do with SpyderPrint.
Walker, when I try to paste the Lab values into the Smoother Tool I get a message that the information is protected and is read only. If I try to unprotect it in the menu above it asks for a password.
What am I doing wrong?
Also you said to “select the Lab values (the 129 numbers under Lab_L) and copy/paste them into the right place in the Piezo Dn Smoother Tool”. I thought I was supposed to paste all 3 columns into the smoother tool.