Art, I have several comments and suggestion based on your reply. I think I’ll put them in what I consider to be the order of importance.
The problem with simply covering half the coated area with clear film and exposing incrementally looking for where the covered and uncovered parts merge is that as you get close the entirety of the print is black or near black and it is exceedingly difficult for our eyes to distinguish tones the closer you get to maximum black. This was driven home to me with extreme clarity in a densitometry workshop I took in 1995 with Phil Davis, author of Beyond The Zone System. One exercise we did was to take a set of pure tone squares printed on photo paper in 1% increments and put them in order 0 (white) to 100 (black). The mid-range was easy, the light tones a bit more challenging though everyone got it, but the dark tones above 92 or 93% were impossible and no one got that part. A densitometer could read the tones clearly, however. This is the reason behind the 90% ANSI standard for photo paper calibration, and is important for Pt/Pd printing too where shadow compression is even more of an issue. Digital negatives do allow us to overcome this to a large degree.
Solarization. This is what you are seeing where you see the uncovered part is lighter than the covered part. The material has reached its maximum density and further exposure actually causes it to begin to lighten. It is indicative of overexposure, and is more often an issue with pure palladium prints. It can also mean that your coating is a bit thin. Moisture in the paper at exposure may play a role too.
Moisture. Ziatype is a printing-out process. The more moisture in the paper at exposure, the more those little molecules can move around during exposure, and the more print-out occurs, at least that is the case with traditional develop-out Pt/Pd. With Ziatype it likely affects printing speed.
Coating. I think this is the single most important skill for someone new to hand-coated processes to acquire. If you are not coating well and in a consistent way, nothing else is going to matter much. The first year or 2 that I was doing Pt/Pd I printed only 4x5 negatives - hundreds of them. They are small enough that the material cost was not much of a factor, and after a while I really knew what a good coating was.
Stouffer Step Tablet. A 4x5 21-step Stouffer step tablet has been the single most useful tool in my darkroom for learning about alt-processes and their characteristics and variations, and how I can learn to control them. It is a photographic film step-tablet with 21 steps in 1/2 stop increments that are large enough to read with the fairly large sensor of a spectrophotometer like my SpyderPrint3. I have probably printed thousands of them over the 25 years I’ve been doing this. They are also great practice for learning to coat and testing variables. It shows you things that you will never notice printing actual images. When this looks good your prints should look good too. Note: This is not a substitute for the digital step charts we use to calibrate our digital negatives. They serve different purposes and both are important.
I think that’s enough for now, unless you have specific questions.
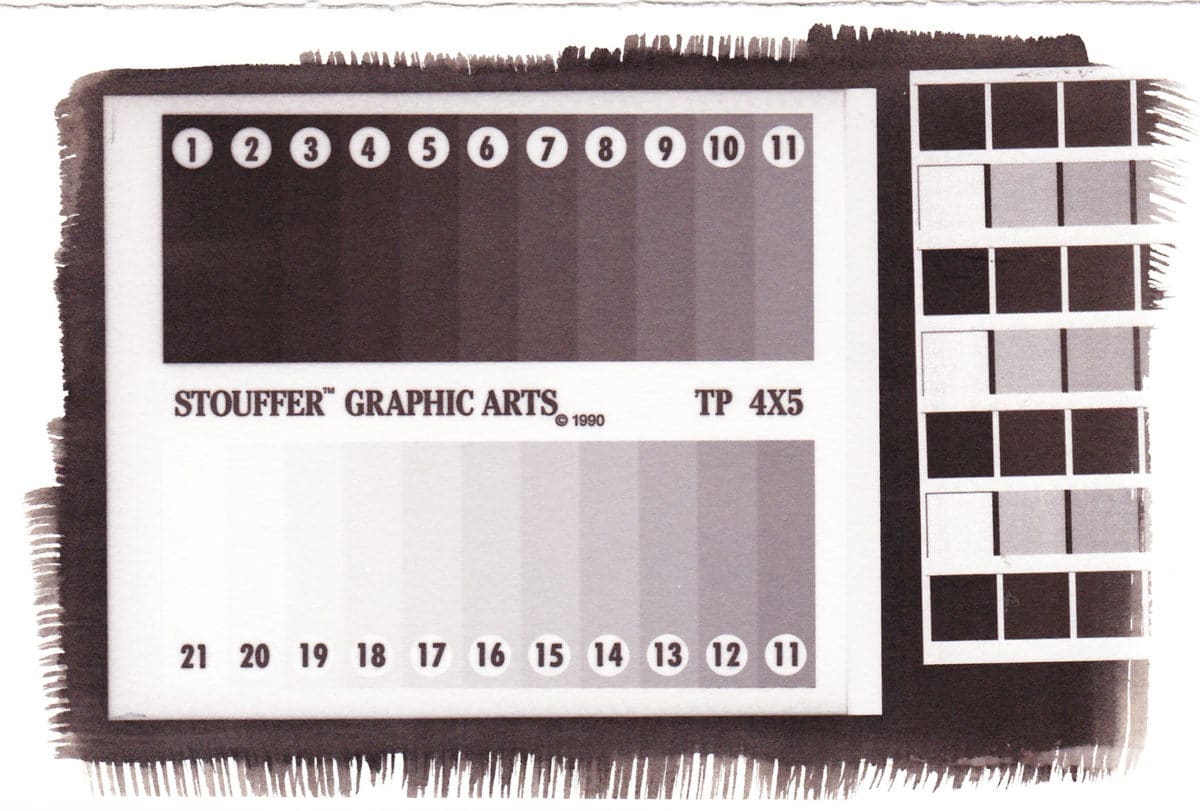
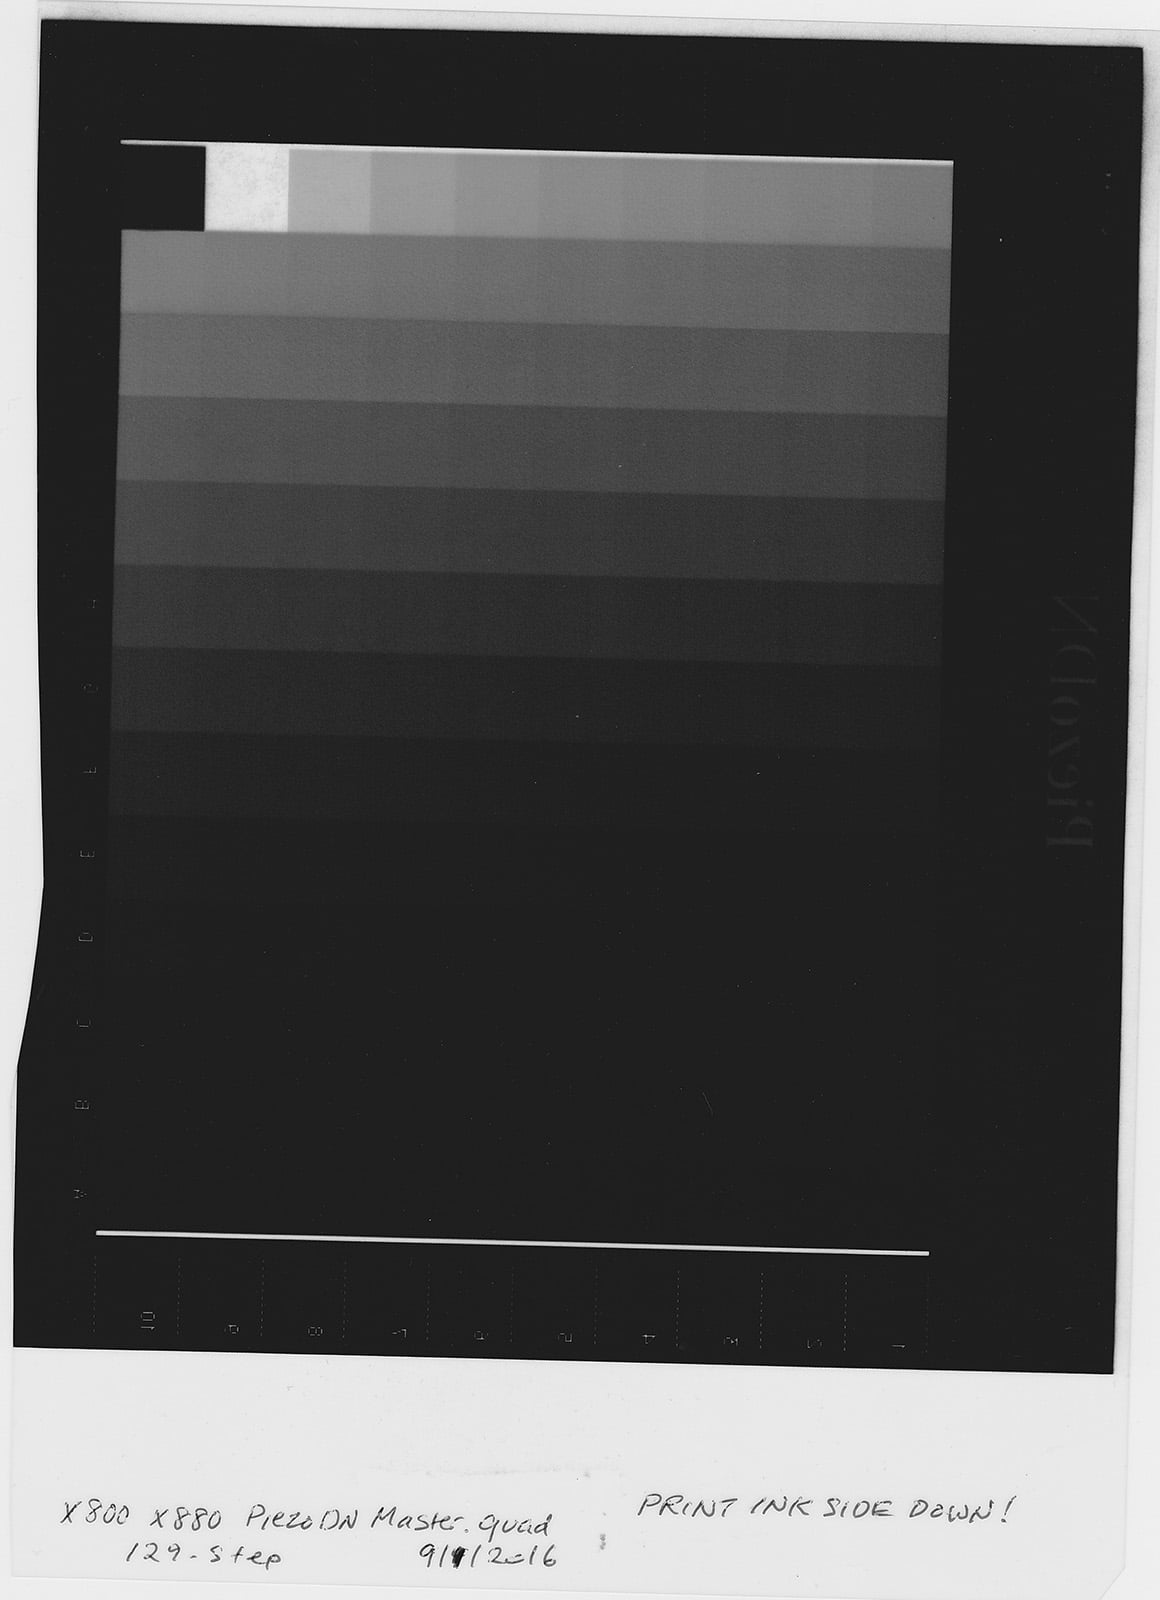
I finally got a Stouffer Wedge to help determine the base exposure. Based on a 12 minute initial exposure, it looked like steps 4 and 5 merged, so I calculated a 3 minute exposure time.
The attachment shows the Stouffer Wedge at a 3 minute exposure time. I also included some partial step wedges, so I could see what 100% black and 100% white would look like. The step wedges were printed using the 3880 master curve.
Three questions:
Any comments on my results?
What can be done to get the 100% white from the partial step wedge to match the 21st step from the Stouffer Wedge?
Does this mean that the maximum black on the negative is not black enough?
It may mean the max dens is not black enough. Download the most recent version and drag/drop the (new) 9800 master curve into your 3880 folder and install it. This has a “bullet-proof” black dMax of 3.5 or so. Should do the trick nicely. Printed out methods seem to need some really intense negatives!
Step 21 on the Stouffer tablet has a UV density of about 3.20 (optical is about 3.05, but UV is more relevant for our printing processes). That means that since you are getting such a long tonal scale with your Ziatype process, you really need a solid black on step 1 of your digital neg. On my current setup, a 3880 with K7 Carbon inks, I am getting a UV density of about 4.00 or a little higher. Previously, on a 1430 with the standard K6 Selenium inks recommended for PiezoDN, I was getting a maximum UV density of about 3.20 which is right on the edge for you. A little less than that and you would see some tone in step 1 of your Ziatype just like in your attached image.
That is likely the issue you are having, and hopefully Walker’s new Master curve will kick it up enough for you. Any chance you have a transmission densitometer available to check this?
ps: There is no logic limit to how dense PiezoDN black can get. The original curves only have the K at like 15%. I just don’t want people to waste too much ink if they don’t need to.
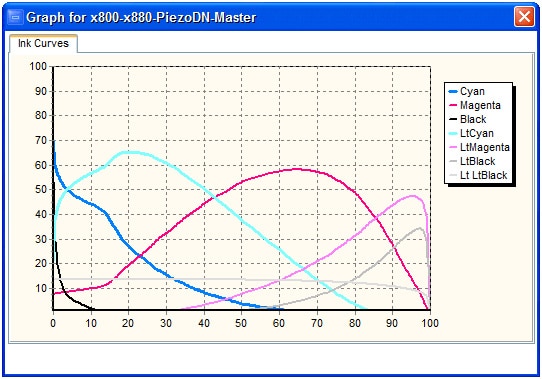
As suggested I’m using the x800-x880-PiezoDN-Master.quad to print on my 3880. I tried printing a “confirmation” print using the linearized curve. It wasn’t linear and well, it just didn’t look right.
So, I went back and looked at the data from the print using the original master curve. I could see reversals in the data, and I noticed that they occurred from one column to the next. For example, if I look at the print, A10 should be lighter than B1, B10 should be lighter than C1, etc. But it’s not. Not to mention some reversals in the middle of the columns as well.
I started to suspect light fall-off in my vacuum printer unit, and perhaps uneven coating as the culprit. So, I printed another 129-step target using the negative from the x800-x880-PiezoDN-Master.quad curve. This time, I also rotated the target 90 degrees in the vacuum printer. The data looked similar to my first print, so I felt I could rule out light fall-off and uneven coating as the cause.
So, I turned to the negative itself. I don’t have a transmission densitometer, so I scanned it with a flatbed scanner. I opened the image in Photoshop and read the L/K values. They showed the same behavior I am seeing in the prints. Which leads me to believe that the reversals are coming from the negative itself, and not light fall-off or uneven coating.
If it’s coming from the negatives, then I believe it must be coming from the x800-x880-PiezoDN-Master.quad curve. Linearizing the curve didn’t help.
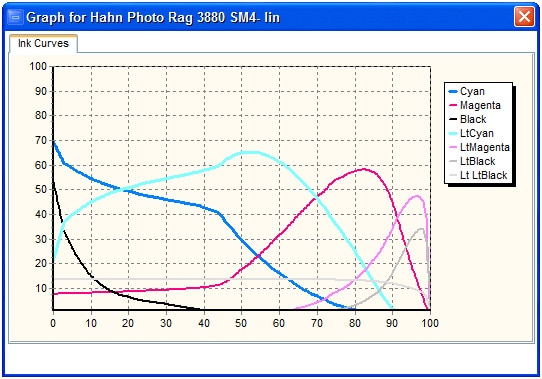
As a side note, I used the smoother tool to linearize a .quad file for piezography, and it worked beautifully. So I feel fairly confident that I know how to use the tools, and that the inks in my 3880 are fine.
Attached is the linearization curve from data printed using the the x800-x880-PiezoDN-Master.quad file. Any thoughts?
FYI, it’s not the master curve. I only changed about 2% of the curve (in the max densities) and I and other people have been printing successfully from it for months now. Something else is fishy.
You scanned this in reflective mode and not transparency mode and the scanner is not properly white balanced. That said, in the patches that can be read (lowest density to about 1/3 of the way down) I read linear results in photoshop.
I suggest scanning this properly, however, my own recent validation of a target printed with the more-dense master shows that it’s linear.
Did you just not install the linearized curve? In order to install a new curve, you have to run the printer install command (or package) again.
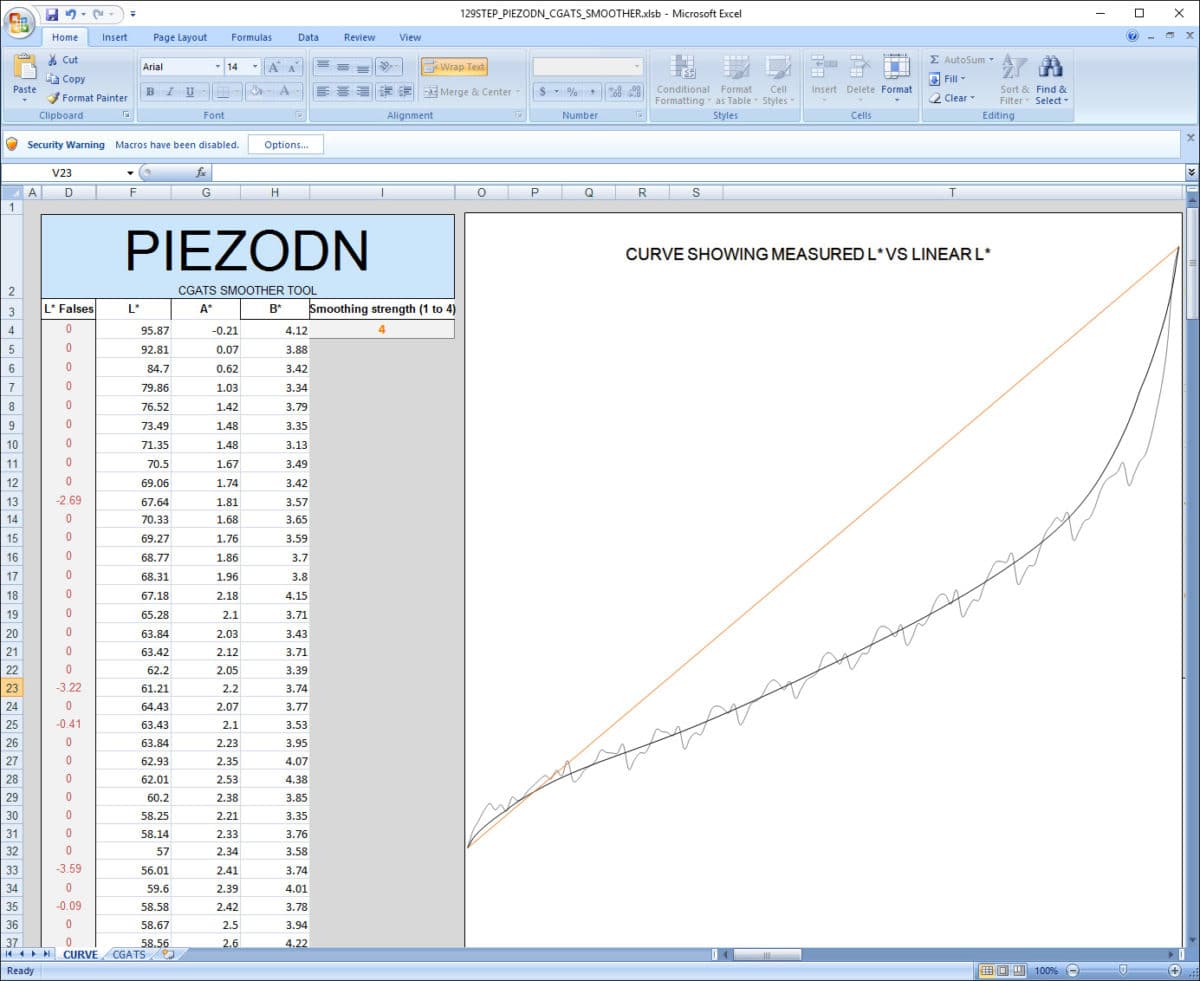
[attachment file=1339]
I’m uploading the image again, this time with selected measured L values from within Photoshop. What I see is that the L values reverse as you move from the end of one row down to the start of the next.
As a test, I tried printing the 129-step onto paper, and saw similar reversals. Furthermore, I went back to the ones I did for piezography, and observed the same pattern. However, the reversals were much smaller, so it wasn’t seen as a problem.