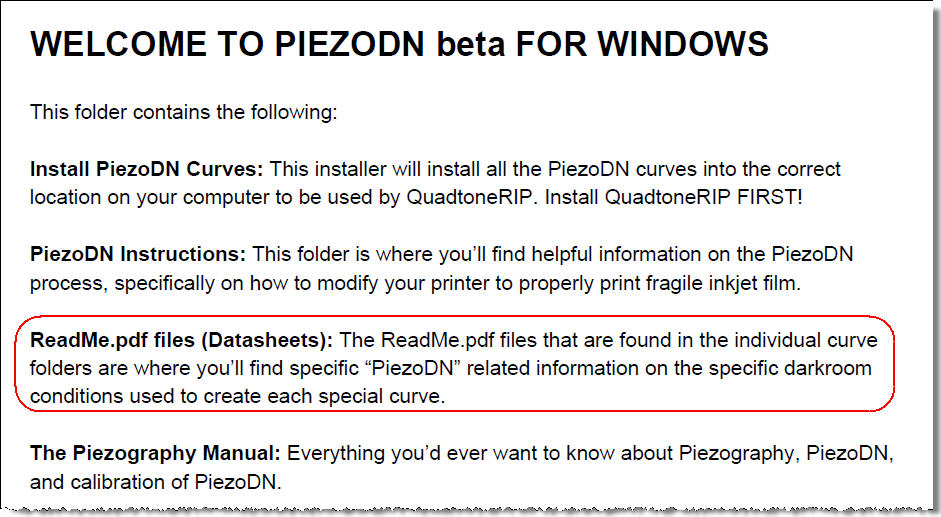
In the Windows distribution of PiezoDN, the ReadMe.pdf in the top-level directory refers to “datasheets” that are supposed to be found in the individual curve folders. They seem to be missing.
Posted this a while back on the forum (a quick search on this site for datasheet will probably pull up the thread) but the datasheets have been miss-leading for people, so I pulled them. Just didn’t take this out of the read-me but will-do when I next update.
-Walker
The Piezography Manual 2017 Deluxe Edition advocates choosing a starting quad based on the similarity of your process to one of the predefined processes, as described in the datasheets. If the datasheets are removed, there is no longer a basis for comparison, and the master quads found in the print model directories for cyanotype, salt, silver, etc. become irrelevant. Maybe they be removed too! Then maybe the next edition of the manual could explain the process of developing your own process-specific quad from scratch, say starting from a single universal master quad, possibly needing to limit it and to iterate in order to linearize. This type of instruction would have been valuable for me in my effort to develop a process-specific curve for New Cyanotype. I started with the cyanotype master quad and never got anywhere with it.
In John’s case, the lack of the data sheet led him down a dead end path on cyanotype since he had no way of knowing that it was intended for Classic formula and not the New (Ware) formula. The file name does not indicate one or the other, and a novice likely would not know that they have very different Exposure Scales.
That situation has been rectified, but one thing I think would be useful is a set of Master or Starting curves for a range of Exposure Scales, sort of like paper grades, which I think you used to do with the earlier PzDN methods.
Examples:
- ES=1.2 for Classic Cyanotype, silver gelatin, maybe gum (this may actually be high)
- ES=1.4 for Pt/Pd (1:1) in ammonium citrate
- ES=1.6 for New Cyanotype (very paper dependent)
- ES=1.8 for Pd in ammonium citrate
- ES=2.0 for Pd in potassium oxalate
- ES=2.4 for salted paper exposed in direct sun
I’m glad to see that you are moving away from the idea of canned curves (or ICCs) since it is something that I’ve been suggesting will be necessary since I came onboard as a beta-tester before the initial public release. I still believe that users will be better off learning to make their own custom curves based on their own process particulars from the beginning, rather than depending on curves made by anyone else. There are almost always differences, as we quickly found out from people using different light sources which produced very different results even when everything else seemed to be the same.
You don’t need a data sheet to tell you that the curve with “Cyano” in its name is the one you should probably start with when calibrating for cyantope even if the old instructions are telling you to choose something “based on data sheets.” The data sheets just said the cyantyope curve was built for the cyanotype process.
PtPd (Platinum Palladium printing)
Salt (Salt printing)
Cyano (Cyanotype printing)
Silver (Silver printing)
etc . . .
//
I’m pointing again to the same link I shared above: https://piezography.com/topic/pt-pd-developers/
//
For those who really need more direction,
I’ll include a truncated “data sheet” as a readme file in each folder on next release but without the specific chemical formula used because this (again) has tripped people up (in the past) who are new to alt-process printing and who expect that if they somehow follow all the “rules” they’ll get a perfect print right off the bat (hint, they won’t, it still needs calibration most of the time).
best,
Walker
Related to Keith:
Yes, I agree entirely but the actually middle slope angle also needs to be in the name. I asked the alt-process list about coming up with a standardized density + slope angle naming schema a while ago but got no real answers or discussion on the topic.
I’ve been toying around for a long time about naming these curves with both the max-density they are built for (the density just beyond step 254) + the slope angle but I haven’t come up with a good way to do this yet.
-Walker
The one thing that PiezoDN “got rid of” was the need to physically limit the maximum density (usually with a curve or levels in photoshop). In general, the density is over-much and then this gets limited or calibrated down such that shade 254 is printable and seeable on the measured darkroom-printed target. This means that generally PiezoDN starting curves are a bit more dense than they need to be but they are then easily pulled into spec for one’s own darkroom requirements.
If I standardize a slop/max-den naming then people can get a fairly good idea of what “master” curve they need to start with for a given process that will give them fully printed tones without having to do this limited process and without being process-specific. With well over 1200 different ink/printer/process combos though, this is somewhat of a massive R&D undertaking and would be marked as PiezoDN v3.0
-Walker
John,
What you are asking for is in there, but maybe with less emphasis than it deserves. I’m pretty sure it will receive more emphasis in the next edition of the manual. Rolling your own from a solid starting point is definitely the best way to go in my opinion, with PiezoDN or any other digital negative method. The thing is not everyone has the skills or means to create the starting curve(s).
It is also what you and I have been doing privately, and you are making good progress with it, although I’m still a bit baffled that you haven’t yet gotten closer to linear. I’m starting to think it is more on the process side than the negative side, but I’m still not sure. More on that later by email.
I’m pretty sure it will receive more emphasis in the next edition of the manual. - Keith
fyi: the next edition of the manual will be entirely in video/audio.
best,
Walker
Walker,
If by slope you mean gamma, there is some info about that in a few articles I’ve seen, but it is not commonly used. Besides, ES is directly related to slope, so it is also redundant. I can get you some data on that, but I’ll have to find the source. I’ll get back to you.
I think my last attempt actually WAS getting closer, and I would have done another iteration except that I ran out of sensitizer. I made a new batch from bulk chemicals, carefully following Mike Ware’s New Cyanotype workshop instructions, rather than the simplified instructions in the Photographer’s Formulary kit (two crock pots at different temperatures!). I am also carefully following his “wet processing” instructions, including the use of an initial 10 minute acid bath followed by a 30-minute wash. So now it should be easier to nail down process variations.
Keith,
I’ve plotted 20 different alt processes against each other and the slopes are different. A good example is Silver vs Salt vs Cyanotype. Cyanotype (old school) has a very steep ramp-up in density in the shadows, a very flat slope, and a very steep rampup in density in the highlights for a linear result in the print. This middle slope angle is much different that Silver (which actually has less density in shadows and some of the highlights than Cyanotype) and Salt (steeper middle all around).
It’s not a LOG (gamma, etc) type relationship me thinks . . . . but yeah, if ES can do it alone, then I would just keep with that . . .
///
Glad you’re getting your Cyano formulation down John!
-Walker
Hmmm … In my Mac installation of the current PiezoDN version, there is a readme file in almost every folder. The only ones without it are the P-series.
Actually the data sheet says: “1:1 mixture of Ferric Ammonium Citrate & Potassium Ferricyanide”. This is the classic Herschel formula (CC) minus the specific concentrations of the solutions. As I think you know, the Ware Cyanotype formula (NC) is quite different and has an ES that is easily 2-3 stops longer. There is no way this Cyanotype master is going to work with it.
I have John starting over with the regular Master and we have found that it does not need to be limited for NC.
Hmmm … In my Mac installation of the current PiezoDN version, there is a readme file in almost every folder. The only ones without it are the P-series.
You have these from older versions that you installed.
-W
Regarding versions: How do users know what version they have? I asked this question in another post in March:
Is there a way to inspect the contents of a piezoDN release before installing it? Or a way to tell which version you have? Normally I would expect to see the version number in the filename, or maybe in a README. It would also be nice to include a manifest (list of contents) that I users can inspect before installing.
It would be even better if each version’s contents was listed on the web site with new content indicated. Like Adobe says for each new release, “What’s new?” Then decide to download and install or not.
This could be a very interesting and productive discussion. I’ve been plotting and analyzing curves for print and film processing for over 25 years now. Maybe we should share methodologies and come up with an agreed upon terminology so that we can be sure we understand each other. I’m game for it if you are. Perhaps a new thread though rather than this tangent here. Or maybe in private discussion. I really wish I could just come out there and spend some time with you on this.
I’ll send you email on this.
cheers!
Walker
@keith sorry you are correct. The Slope is the Gamma(g) in film-density land. I forgot my basics yesterday.
(D2 - D1) / (Log Ex2 - Log Ex1) = Slope (or Gamma)
I’m making a film curve characterizing tool and will propose a naming thing from there.
W
In Cyanomicon p. 138, Mike Ware says
For the new cyanotype process the Δ logH scale [exposure scale] may vary typically from about 1.6, equivalent roughly to a Grade 0 silver-gelatine paper, to a ΔlogH around 2.4, which is a far longer scale than any silver-gelatine paper.How do you determine the ES for your process? Is it as simple as this? Print a target, measure Dmin and Dmax with a spectrophotometer, and take the difference (Dmax - Dmin). If I do this for my New Cyanotype process, I get 1.45 - 0.5 = 1.4, which is definitely on the low side. So I would choose the starting curve with ES = 1.4.
But maybe that’s not the right way to do it!
When I was testing papers for New Cyanotype (NC) last fall I found a surprisingly wide range of variation among those I tested. I also was reminded reading Ware’s books and articles that there is more than one way that people calculate Exposure Scale from the same data. I use a method intended for use with analog film that takes into account the toe and (especially) the shoulder of the characteristic curve of the process (including the paper). Basically, the toe (hightlight) is set at 0.04 over paper white, and the shoulder (shadow) is usually set at 90% though this can be adjusted to suit the users needs. This is an old ISO standard that has been used by photographic film and paper manufacturers for a long time, and it is critical for printing analog film negatives directly to prevent the loss of highlight and shadow separation due to the compounding effect of the interaction of the toe/shoulder of film and paper curves. With digital negatives, however, we only have to deal with the characteristic curves of the paper/process, since we can tune the film to match it. This means we can use the entire length of the Exposure Scale in analyzing a paper/process without the need to adjust for the toe and shoulder.
I have used Phil Davis’s BTZS Plotter program since 1991 to help me with this kind of stuff. Initially it was a Mac OS9 app, but the last version from c.2000 was Windows only. I run it on my Mac using CrossOver. It is still available here: BTZS Plotter for Windows
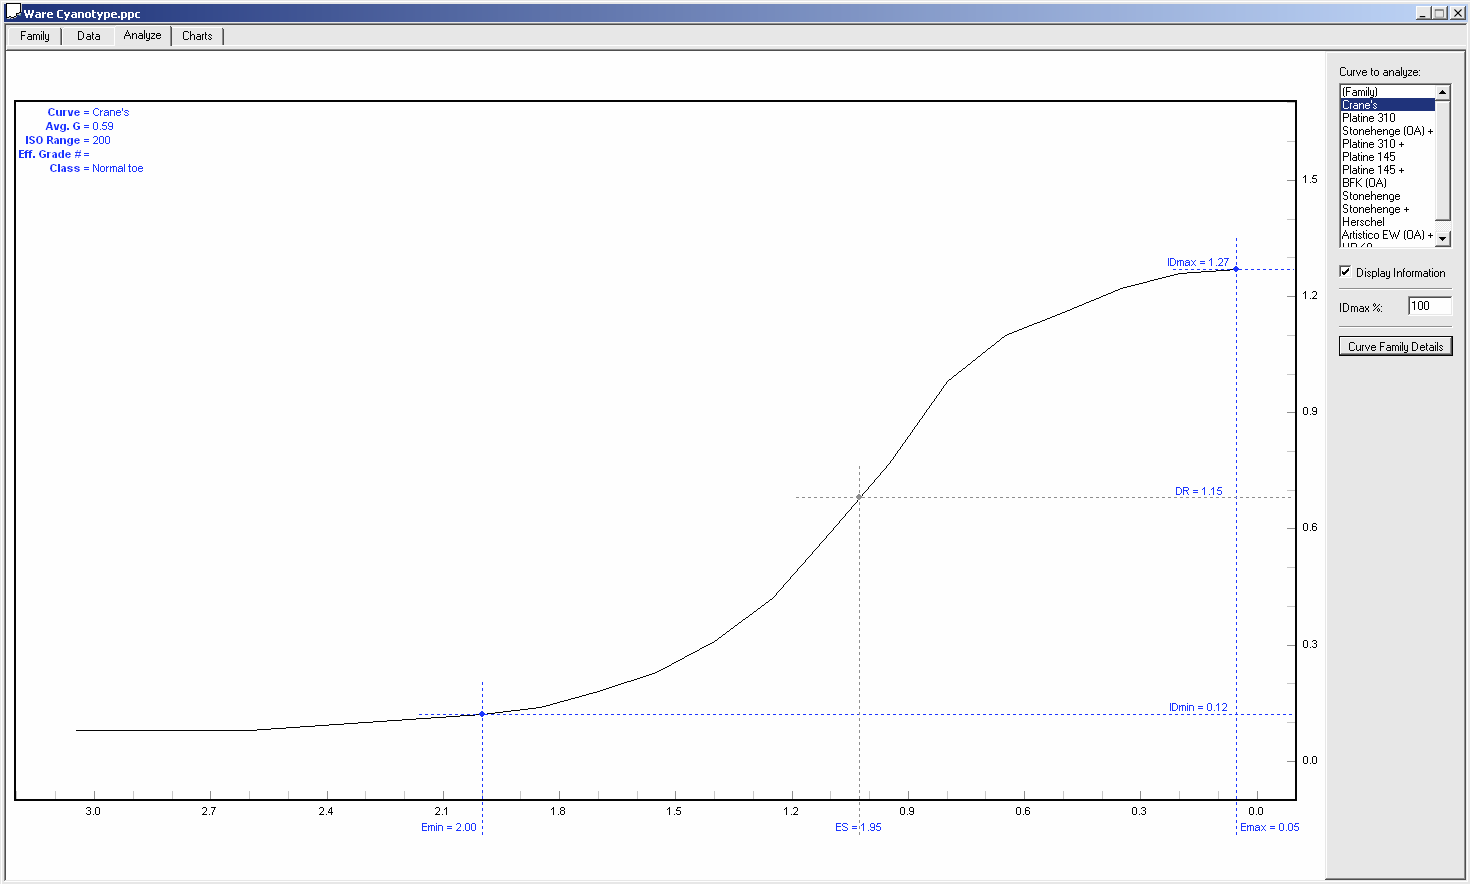
When Mike says that New Cyanotype has an ES of ~2.4, he is using the entire length of the scale from Dmax to Dmin. On a Stouffer 21-step, this would be 16 visible steps of separation, or 8 stops. One of the papers I tested, Crane’s Premium & Resume (PS8111), actually has an ES of 2.7 calculated this way. By comparison, plot the measured values, the ES is 2.65; if I set maximum image density (IDmax) in BTZS Plotter to 100%, the ES is 1.95; if I set IDmax to 90%, ES is 1.49. In the latter 2 IDmin is still fixed at 0.04 over paper white since the software has no provision to change that. I’m sure you can see that these various methods of interpretation might definitely be a source of confusion.
For those of us who still print from original film negative, the 90% method is the most useful. But for digital negatives, we really should be using the full scale. Plotting the measured values and using the full scale is slightly more accurate than simply counting visible steps and multiplying by 0.15.
Now, about John’s calculation: Print Dmax - Dmin = Density Range (DR), not Exposure Scale (ES). ES is the range of tones in the negative that will produce this DR in the print, and with NC it is highly variable from one paper to another. To calculate ES:
- count the number of visible steps and multiply by 0.15, or
- plot the measurements on a graph where the x-axis is exposure in stops representing the 21-steps of the step tablet (0.5 - 3.05 is the theoretical range, actual may differ slightly but it's not significant), and the y=axis is Density
Here’s an example of a graph from BTZS Plotter:
[attachment file=30399]
The Plotter also calculates Average Gradient which is similar to Gamma.