I know many of you are using a spectro like the i12 pro and Colorport in order to make spot measurements of Lab and Density values, when assessing printing tests, etc. I am not talking here about the linearization of PiezoDN as it is explained in the manual, but just using Colorport and the spectro as an alternative to a densitometer to read density values (Dmax) of printed tests, etc… I think Walker mentioned something about this being the method he used?
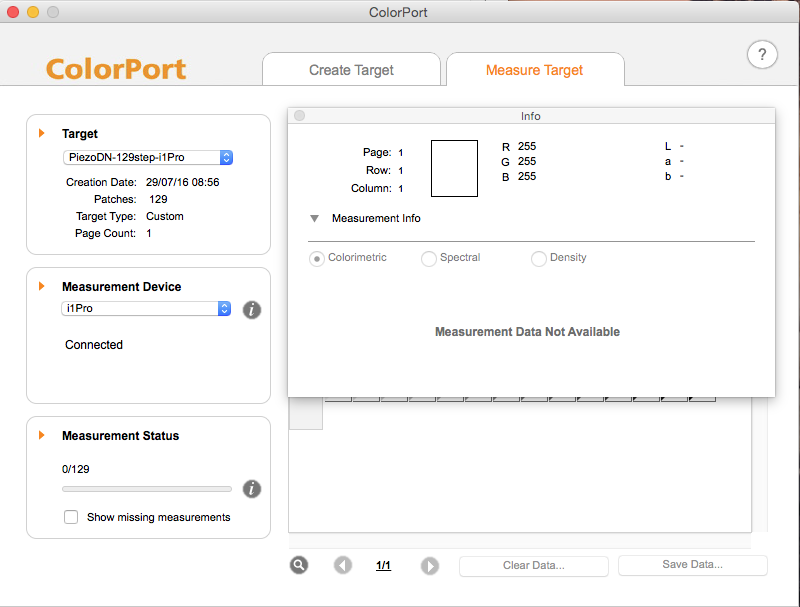
The problem I am having with ColorPort (both on a Mac and on a PC) is that the option of choosing the measurement info (colorimetric, spectral or density) appears greyed-out and I cannot choose anything but colorimetric. Right below, it reads “Measurement data not available”. However, I perform spot measurements and the values of RGB appear and I can advance along a test chart. I have supposed than when one is only interested in making a handful of spot measurements, one can just choose any chart of the database, since the only thing we are interested in is the individual values appearing on the Measurement info window…
Is there anything I am doing wrong? I suppose if choosing Density I would be able to read the Density values right like the densitometer does?
Thanks so much in advance!
Rafael
Note: Screen attached showing the situation in both my two computers…
As you know, I am just beginning to learn to use my i1 Pro and ColorPort. The problem is that for reading from prints of Stouffer tablets, like we were talking about, the step numbers are reversed from what ColorPort expects. Maybe we need to make a custom target to make this work better. I think I accidentally discovered a way to activate the part if the Measurement Status Info panel that you are looking for. Once you have made 2 or more readings you can click on a patch on the target and the previously grayed-out section if the info panel will become active. You can then select Density.
They don’t make it easy to do a small number of spot readings.
Yes, thanks for the tip… that was so dumb of me! I realize the information about Lab and density is only given ONCE the measurement is made… I thought that information would come straight away.
Yes, I agree with you it is difficult to find a software with easy spot readings of density… Using iprofiler is even worse!