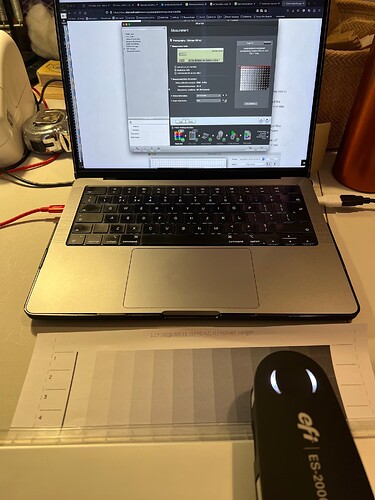
I took a plunge on an ES-2000, and while you are correct @bw_studio in that it does not work to create profiles in i1Profiler, it does actually work in i1Profiler to take measurements.
I can confirm that with the ES-2000 plugged in I am able to load .pwxf Piezography test chart files into i1Profiler and then take measurements (in spot mode only - see further below) of the printed chart using the ES-2000 that I can then save as .txt files, from which I can get the data (namely L values) that I need to copy-paste into PPEv2 spreadsheet.
I am running i1Profiler 3.8.4 on Mac OS Ventura 13.5, M1 Max MBP.
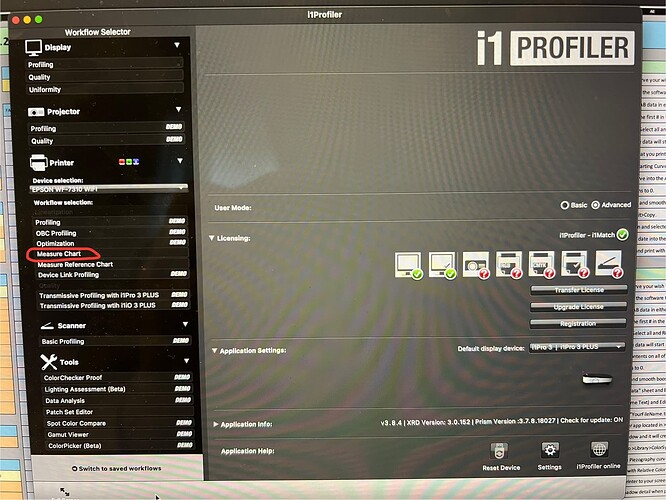
See here the screen when Advanced mode is selected in i1Profiler. Most functions are marked “demo”, except crucially “Measure chart”, which I have circled in red. Note I do not have all the licenses you mention (which as you rightly point out are needed for making profiles - but only if doing so entirely within i1Profiler). I bought the ES-2000 as unused (unregistered) but have not registered or verified it with any license codes in any way.
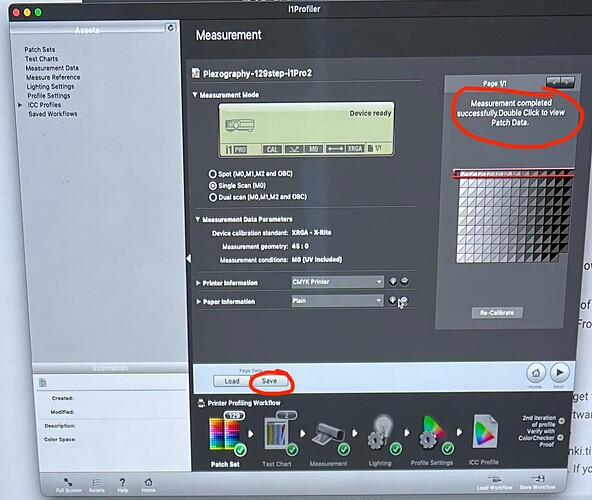
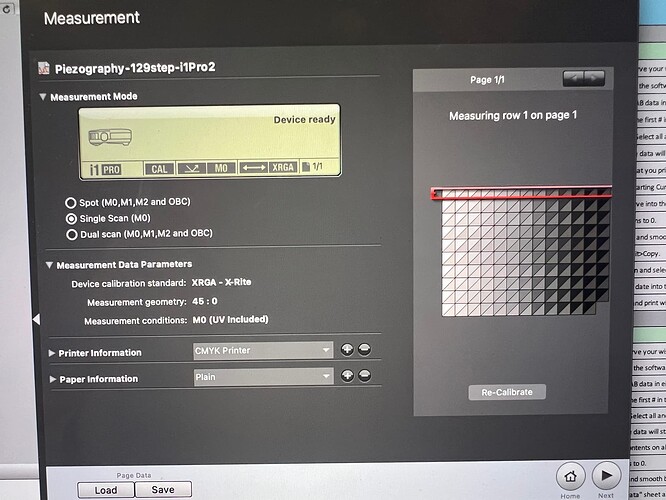
There is a little weirdness with i1Profiler in that each time I start the program up it is not immediately able to load the .pwxf files that accompany each test chart .tiff file - they appear greyed out in the load window. However if one hits the “Load Workflow” button and then from the load window right click and “Quick Look” on the relevant .pwxf file, then tap away Quick Look, the file is now selected and can be opened. Sometimes I need to Load Workflow → open the .pwxf file a second time for the test chart to show up in the i1Profiler window. Loaded up properly it should look as so:
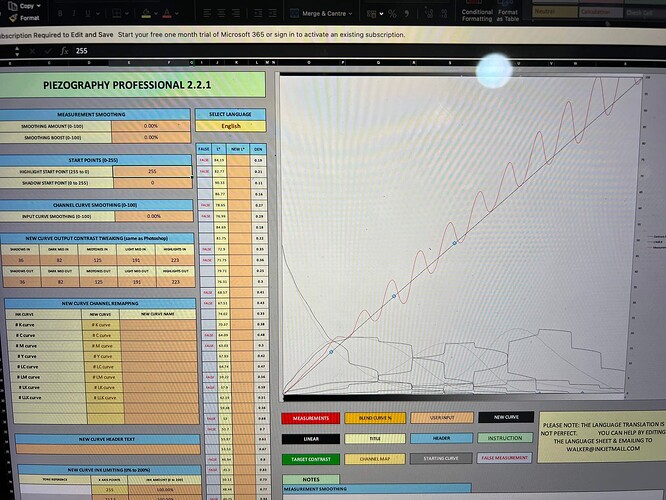
So, brilliant, I can indeed use the ES-2000 with recent Mac OS on an arm64 Mac for taking piezography measurements - all good, right? Well, no, not quite. While I get results as expected taking measurements in spot mode, I am repeatedly getting a sawtooth line when taking measurements in scan mode.
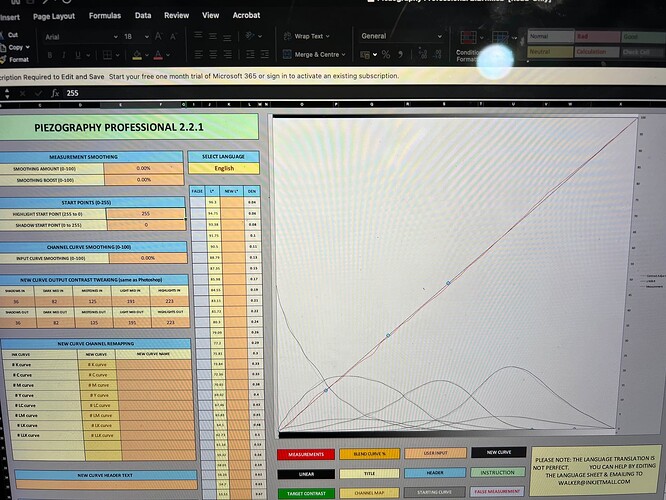
This is what I get when taking spot measurements of a test chart printed on paper using a curve that I have previously linearised and ink limited for that paper to as ‘perfect’ as I could get it, so it is a good reference.
But when I take measurements of the exact same test chart print using scan mode, it looks as so:
I have left off any smoothing at all just to show the full extent of the difference.
I have checked the sample ID, position and sample name of each measurement in the saved measurements .txt files and can see that i1Profiler looks to be compiling the measurements in the proper order just fine.
Has anyone experienced sawtooth measurements with an i1Pro 2 or ES-2000?
Is it dodgy hardware? Or is it firmware related? If it is to do with it being an ES-2000 then how come spot measuring seems fine?
I get the same outcome whether measuring a 51 step chart or a 129 step chart.
I have tried with the 21x16 and 31x9 charts but - another weirdness - I cannot seem to get past measuring the first line of those charts, I just get told by i1Profiler of a measurement error and that I need to try slower (I am being very slow and precise). Maybe that’s something to do with the .pwxf files for those charts though?!
