I started using the PiezoDN system with the old ink setup (5 inks including the special shades 2.5 and 4.5), on a 3880. I use the negatives to make Pd prints.
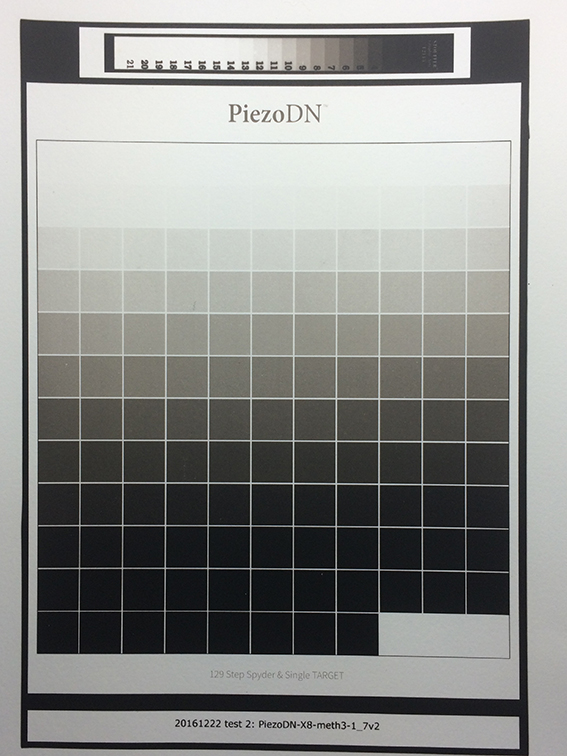
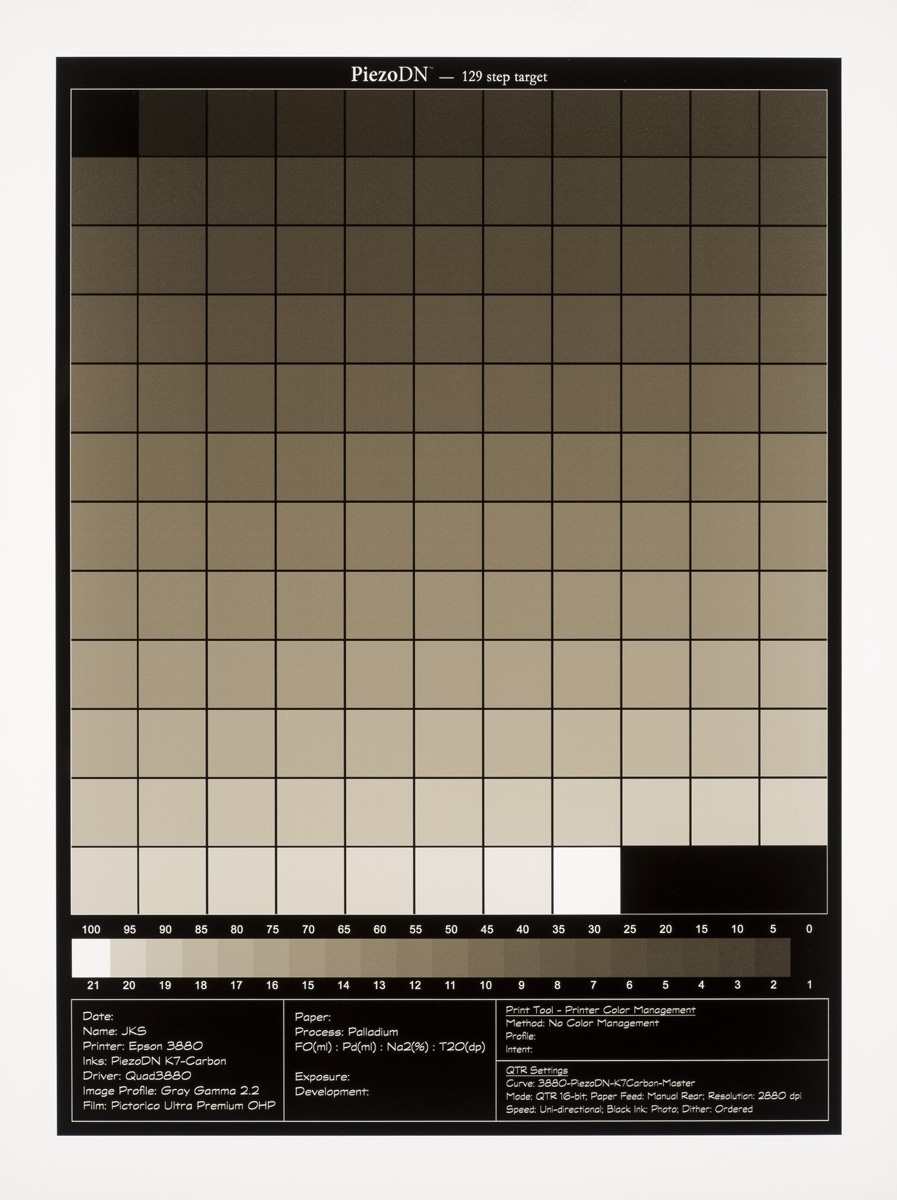
As a kick off to start the linearization process I used a specific curve made for the older ink setup: PiezoDN-X8-meth3-1_7v2. The 129 step tablet print with this curve is shown in photo 1. With a Spyder spectrophotomer I measured the Lab-values. These values looked quite normal, going from appr. 96 to appr. 21, in descending order.
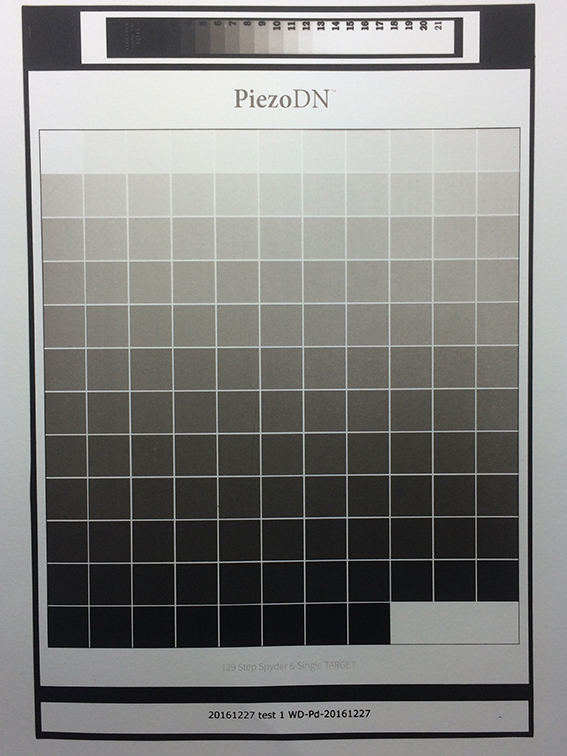
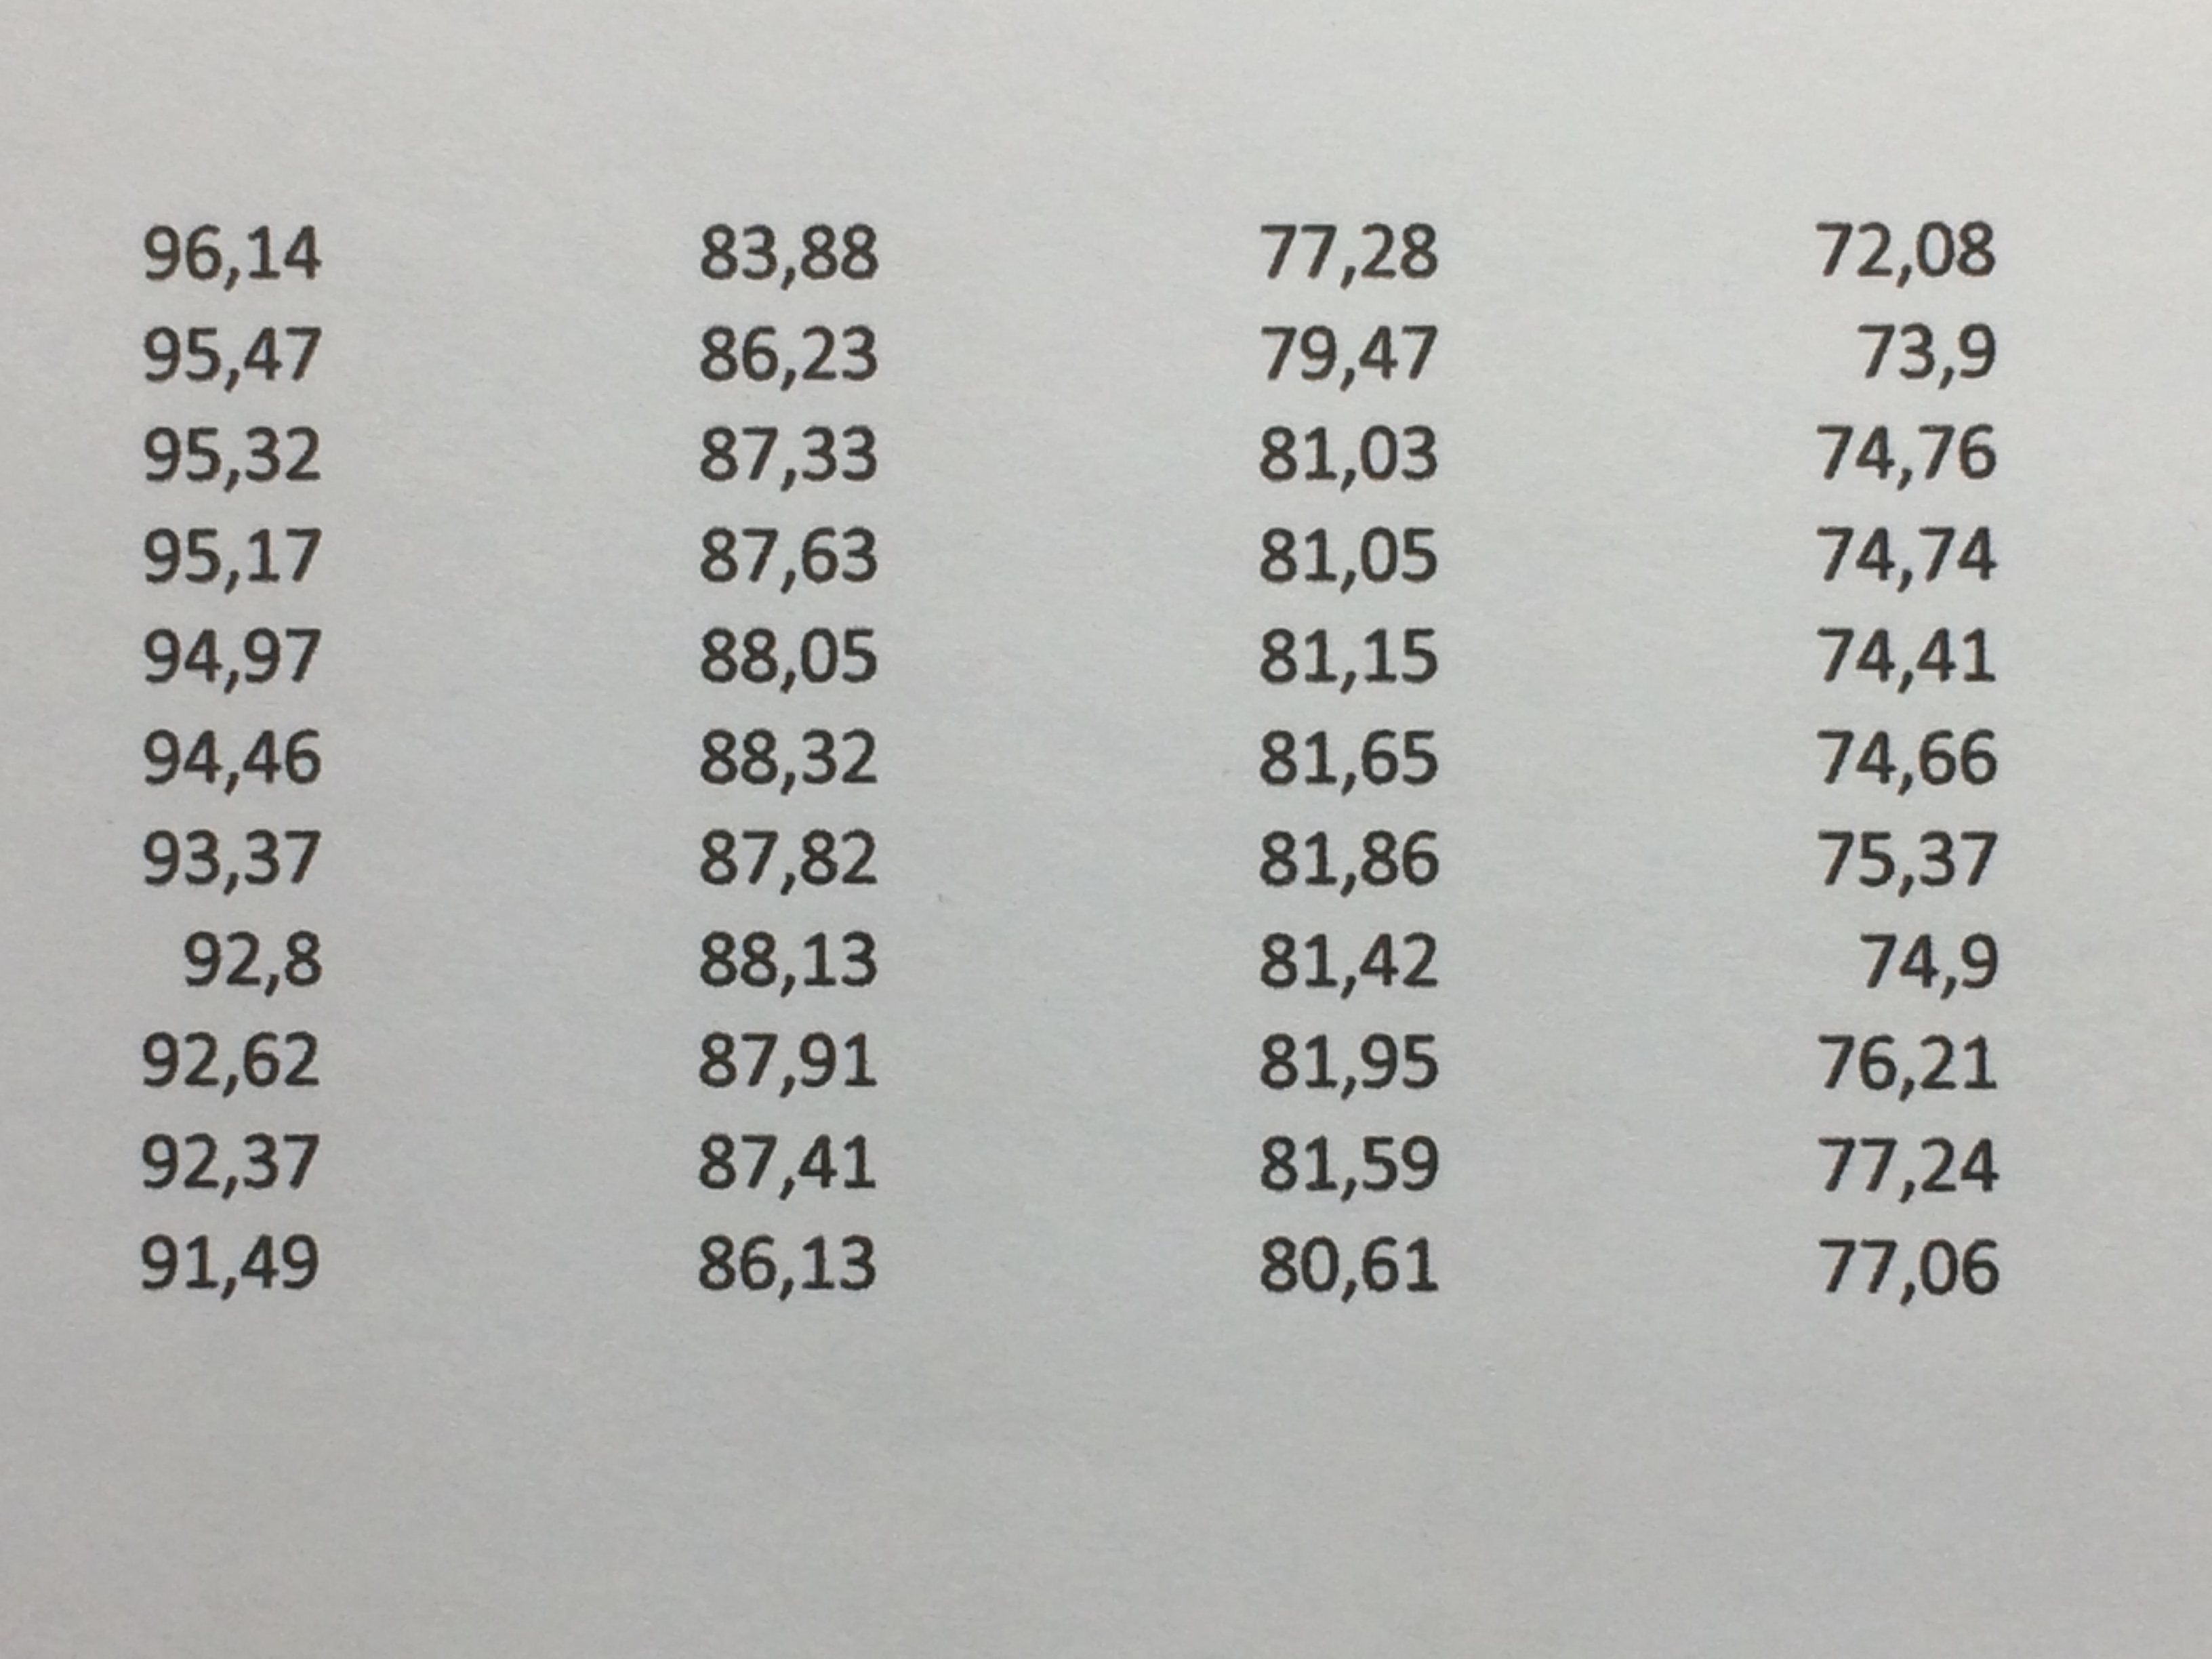
With these values I linearized a new .quad curve: WD-Pd-20161227. I printed a 129 stepwedge negative with this curve and made the Pd-print. The print (photo 2) doesn’t look good and the Lab-values are definitely wrong. I sorted the L-values in columns corresponding with the rows of the print; in photo 3 the first 4 rows/columns are shown. The first row/column (I call them row from here) is OK, but from the second row something very strange is happening. There is a huge drop from the last value of the first row and the first value of the second row, and from the second to the third row, etc. Within a row there is hardly separation. This continues until the final row of the Pd-print.
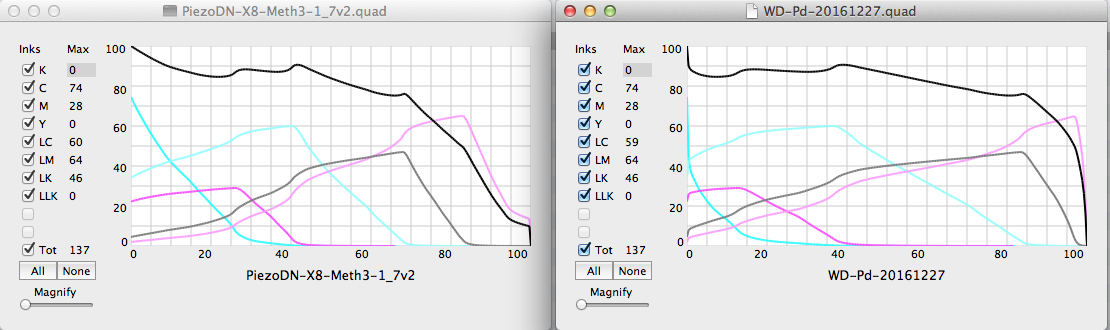
I made a print of the two .quad curves (photo 4) and I checked the inks positions (they are as they should be):
shade 2 on C
shade 2.5 on VM
shade 3 on LC
shade 4.5 on LK
shade VLM
The negatives are printed at 360 dpi.
I cannot explain or understand what is happening and I’m very lost now. Please help someone!
I think it was back it August, another user (I think it was Art) brought up this issue. His illustrations (scans) were not of high quality so it took a while to figure out just what he was talking about. He was using a 3880 though, and I was switching to a 3880 at that time. So once I wrapped my head around what he was saying I looked for it in my 129-step negs and prints. To my surprise it was there in mine too. Further discussion with Walker led to speculation about something to do with pressure in the head causing one edge to print darker than it ought to or something like that. I tried several things to try to alleviate the problem: adding bands of black to the left and right of the target, printing it with a black border, printing it on a larger sheet, etc. The only thing that made a difference was to print it rotated 90 degrees. But then the effect was still occurring at the top and bottom of the target, though it wasn’t visible, rather than at the left end right.
[attachment file=26366]
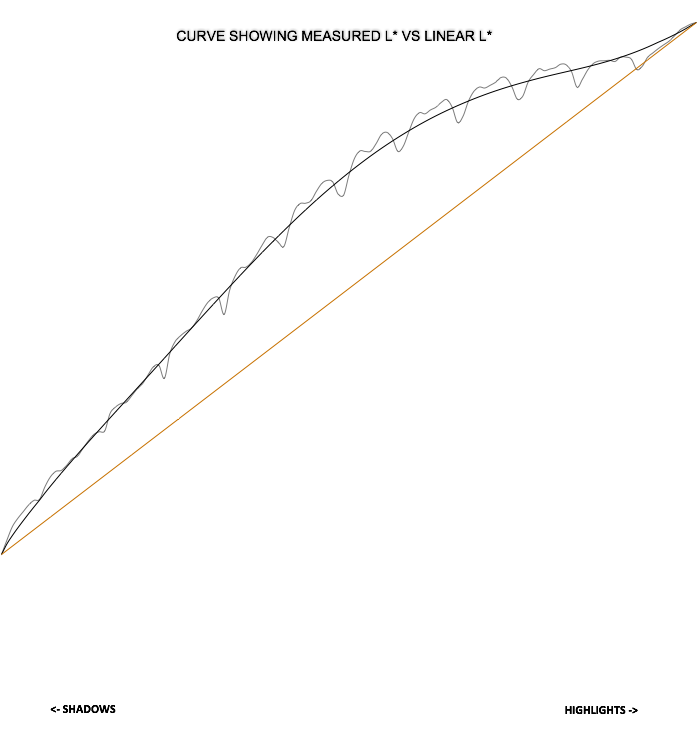
I describe this phenomenon as “waves” in the target values. It is not unusual to see small wave-like fluctuations in the Smoother Tool graph of the print of the 129-step due to a variety of things like coating irregularities, paper texture, read errors, etc. One of the purposes of the Smoother Tool is to deal with that. But here, since we are getting this in the negative, it is amplified. For me, it didn’t have any negative effect on the ability make good linearizations, and there is no sign of it in actual prints.
[attachment file=26367]
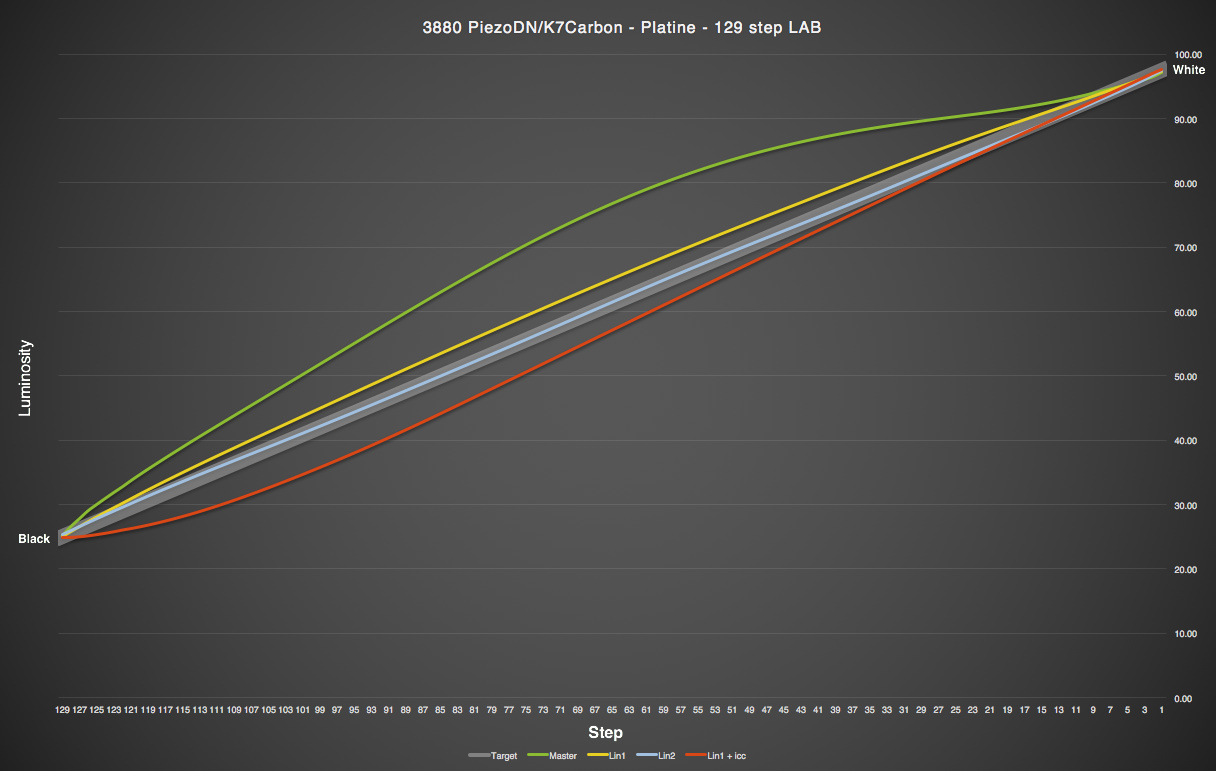
I wouldn’t be too concerned about what you are seeing in the CurveView graphs. But what would be useful to look at, and to show here, is a screenshot of the Smoother graphs. Since the Smoother does not allow us to save the graphs for future reference, I use a spreadsheet of my own for that purpose. You may have seen some of my screenshots of that in other threads. It’s fairly easy to set up, but I’ll be happy to share mine if you (or anyone else) would like. This graph shows my entire calibration sequence for Platine - Master, Lin1, Lin2, and Lin w/ICC.
Yes, that is my usual progression. Sometimes I do a 3rd lin with some of the weirder papers I’m using if I think it might be useful, but some of “normal” papers get there on the first round.
One thing I’ve noticed with the few ICCs I’ve made is that is seems to be a real equalizer. By that I mean that regardless of the paper or how close to perfect the linearization may or may not be, when combined with an ICC made from that linearization, the results seem to be pretty close to identical.
Personally, I don’t really like the characteristic effect of the standard ICC - darkened deep shadows, compressed shadow detail, increased contrast in the highs and mids. I know they can also be customized via the Curve Adjustment tool, but I haven’t gotten to that yet. Enough experimenting for me for a while. I’ve got a printing project that needs to be completed and I can’t delay it any longer.
The Pictorico sheet is A4 (210x297 mm), the 129-step target size is 155x224 mm, including a 13 mm black border around the target.
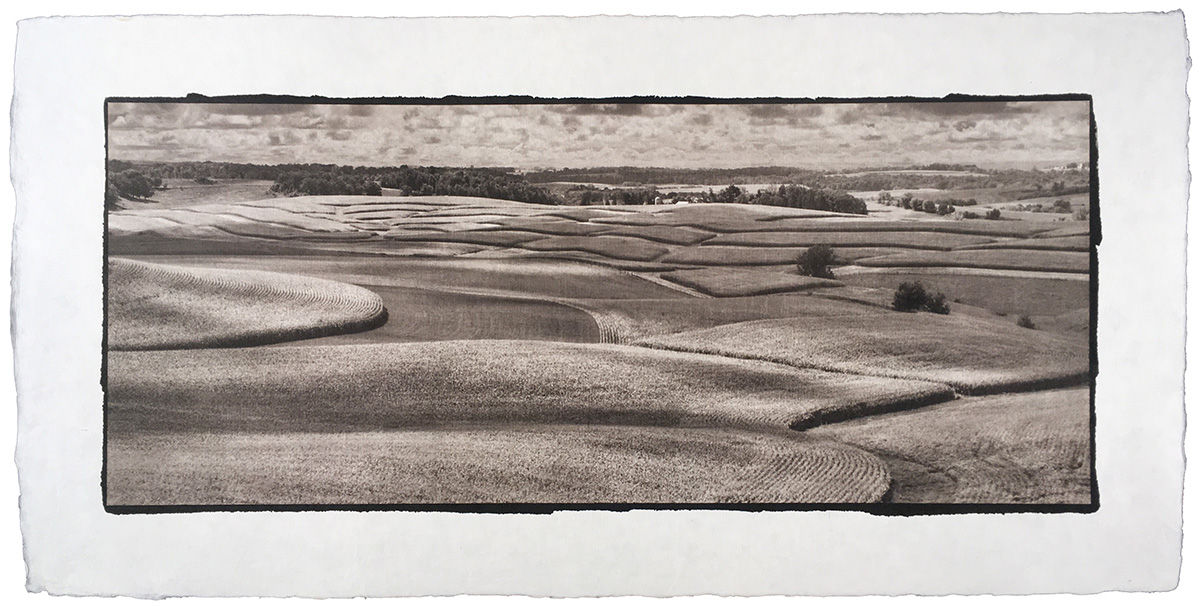
The negative of an actual image is printed on a 242x329 mm Pictorico sheet (a 13"x19" cut into 2 halves). The image size is 220x290 mm, including a 20 mm border around the image.