You might help me with some questions I have concerning the linearization of the Hahnemuhle paper when printing with a plateburner of 4000 W (630 seconds). The maximum xposure time has been checked and is looking good, with Dmax on all targets printed according to what I obtained in the test strips and Stouffer tests.
Basically, I have started with the Master Curve of IJM for PD only. I have printed the target (v1), made measurements (M1.txt), linearized the master quad > obtaining the v1.quad
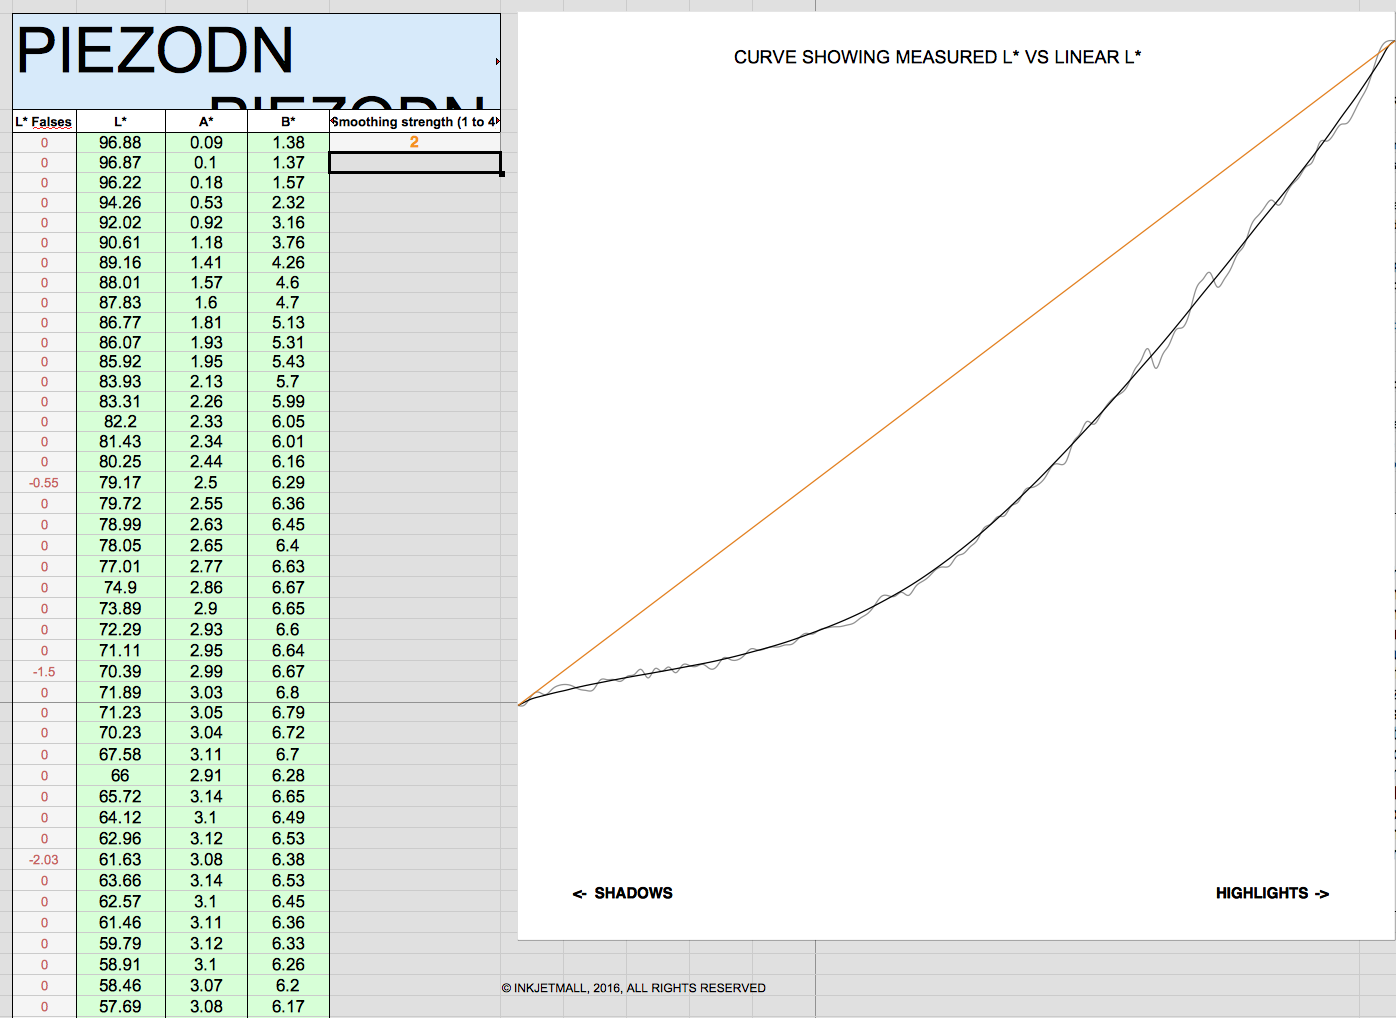
The result, that I post here, was way off and typical of plateburners according to our great Keith.
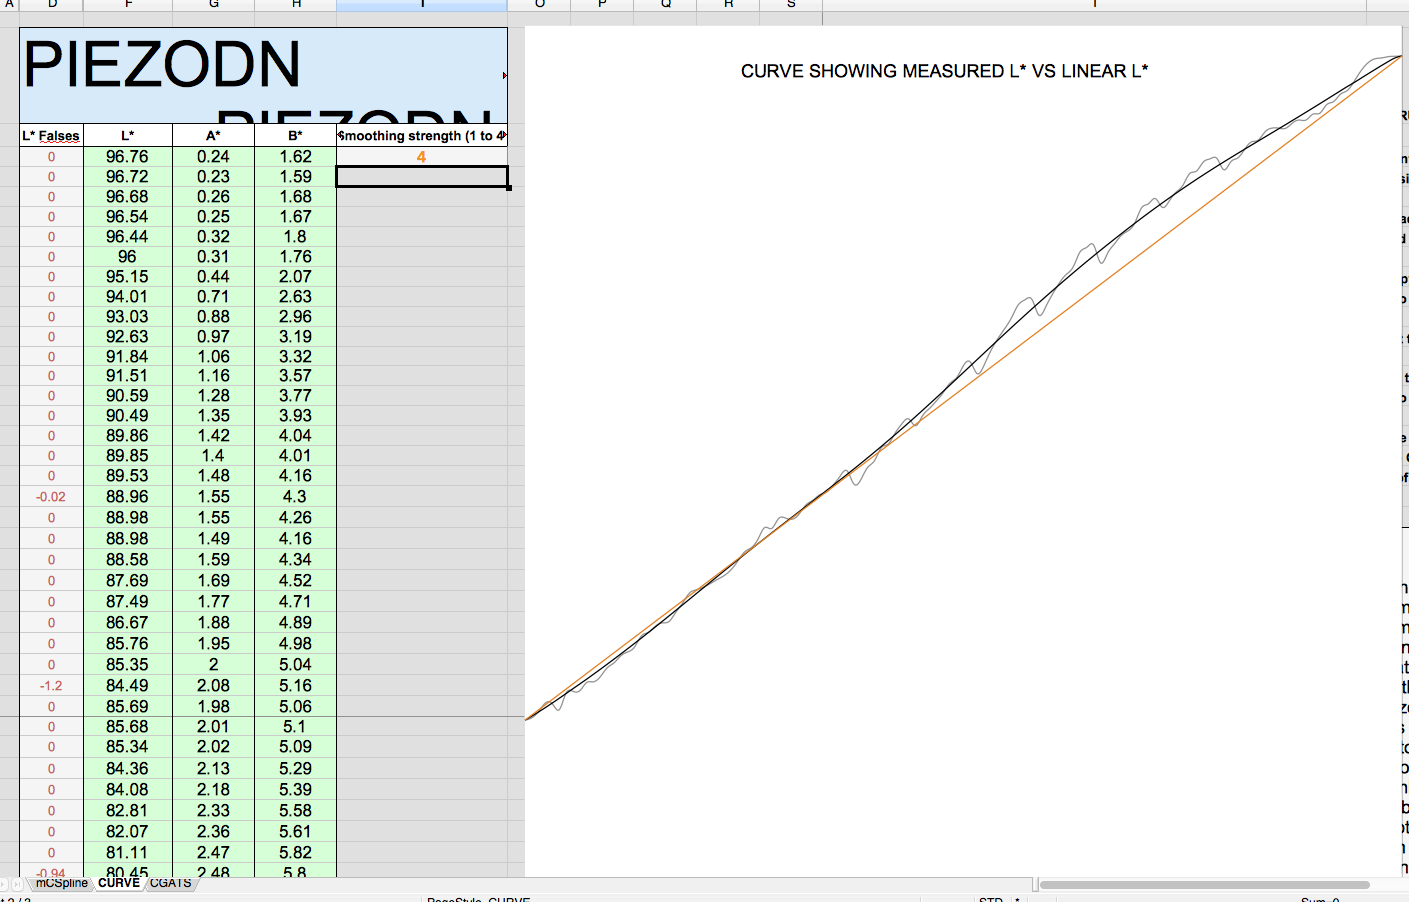
Then I printed a second target (v2) by using the v1.quad, made the measurements (M2.txt) and realized that I had the shadows spot on, but the highlights were a bit off (this time in the other direction, lighter).
As I saw the highlights off, I decided to not stop here, and continue to fine tune the linearization.
What I did was to smooth the measurements M2.txt, and relinearize the v1.quad > obtaining the v2.quad.
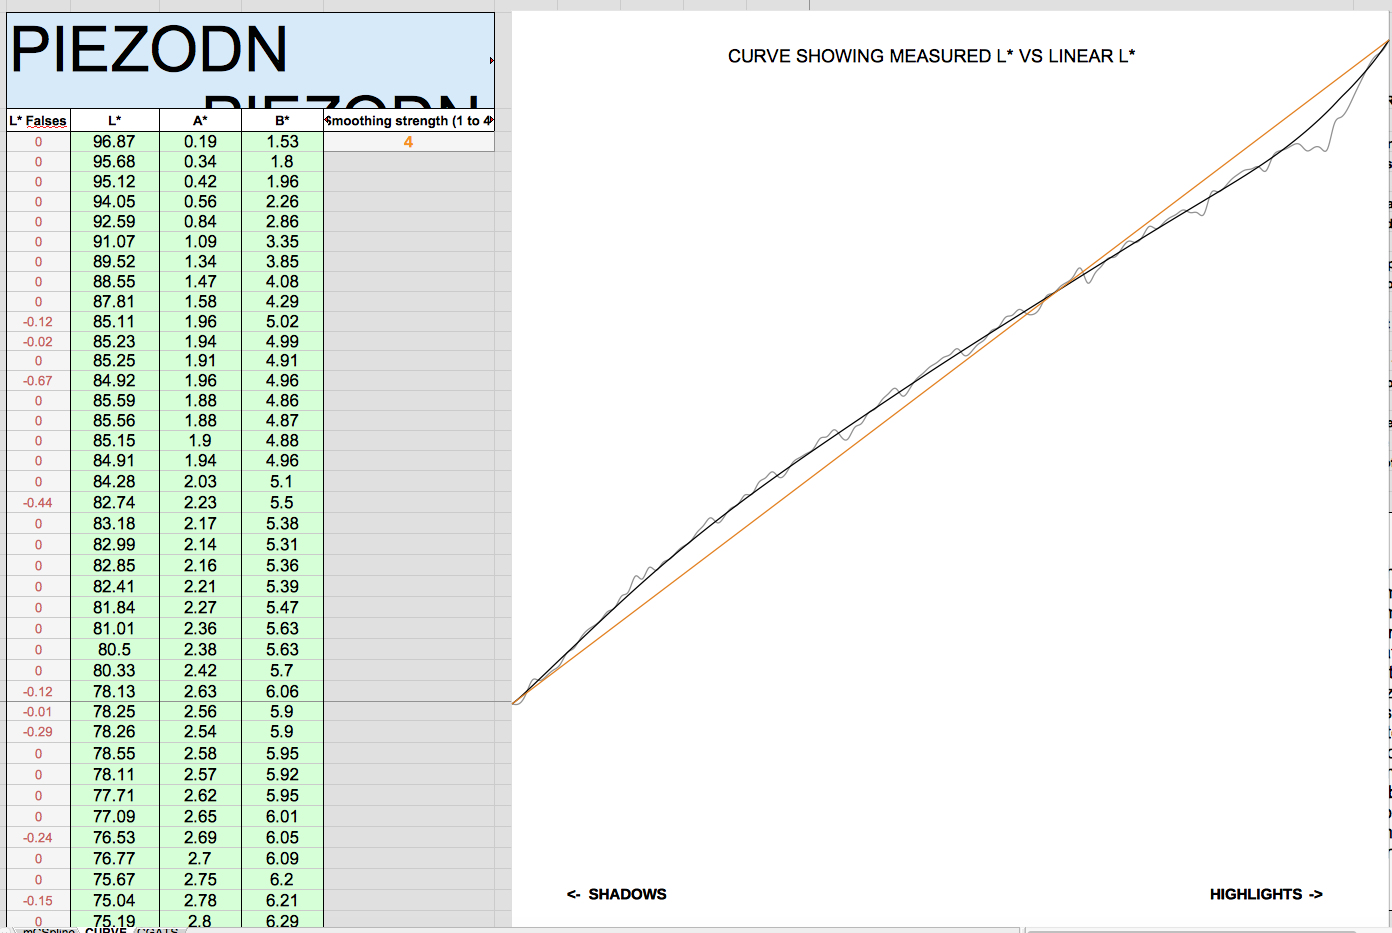
I then printed another target (v3) by using the v2.quad. I made the measurements (M3.txt) and I obtained now the shadows a bit off (lighter) and the highlights off in the opposite direction (darker now!).
My two questions are:
Is this normal, that after a while curves start playing tennis as we check the linearized values?
What could be happening in my case?
When does one stop linearizing in succesive steps like this? Are we supposed to control the final results and stop only when the results are perfectly linear? Basically, I understand that once one linearizes the quad file based on the last measurements, in theory we should have the system taking care of the deviations from that moment on… but then, I guess if we reprint with the last linearized quad and measure, we should arrive to spot on linear values, right?
My other question concerns the creation of the ICC profile. If you want to obtain and apply the ICC and you have run more than one “round” of linearization, can you obtain the ICC based on a measurement, AND also linearize the quad curve based on those same measurements?: What I mean, is doing the following thing: print first target with master .quad - print Pt and obtain measurements M1.txt - linearize master quad based on M1.txt - obtain quad v1 - print with quad v1 - print Pt and obtain measurements M2.txt - relinearize quad v1 based on M2.txt - obtain quad v2, AND THEN also obtain ICC profile from the very same M2.txt that you will use when printing with the quad v2. In the manual, it is suggested you linearize based on M1.txt, and then obtain the ICC based on M2.txt… basically then, printing with quad v1 (obtained with measurements M1.txt) and using the ICC (based on measurements M2.txt. I just wonder whether, once you have the measurements M2.txt, it does not make sense to fine tune a bit more the quad curve by linearizing these values too…even if you did it just to obtain the ICC like they explain on the manual. I hope you did not go mad with this explanation!
Tennis happens with this system mainly because you can actually SEE (for nearly the first time) very small L* shifts. These are shifts that are effected by darkroom and coating conditions (or dry-down time of the neg) but really would not show up much in an actual print. Print v3 again some other day (keeping the conditions as similar as possible) and you will likely see a different L* slope.
Related to ICC, if the L* slope is linear (or nearly linear) the Default ICC PtPd will work perfectly (it is built for a linearized curve). For workflow constancy I suggest simply using that profile on top of a linearized curve. I’m going to be getting rid of the individual iccs in v3 of PiezoDN (the driver) when that drops.
Thanks Walker. That is what I imagined, that we are seeing things we never saw before… Thanks for the clarification.
So if I understand correctly, you urge us to just use the ICC standard you provide with the system on top of our “best linearized” curve, and stop measuring data from our printed targets to build the ICC, right?
First, I think the best smoothing strength to use depends on the magnitude of the peaks and valleys. Use as much as is necessary to smooth the worst parts, but no more.
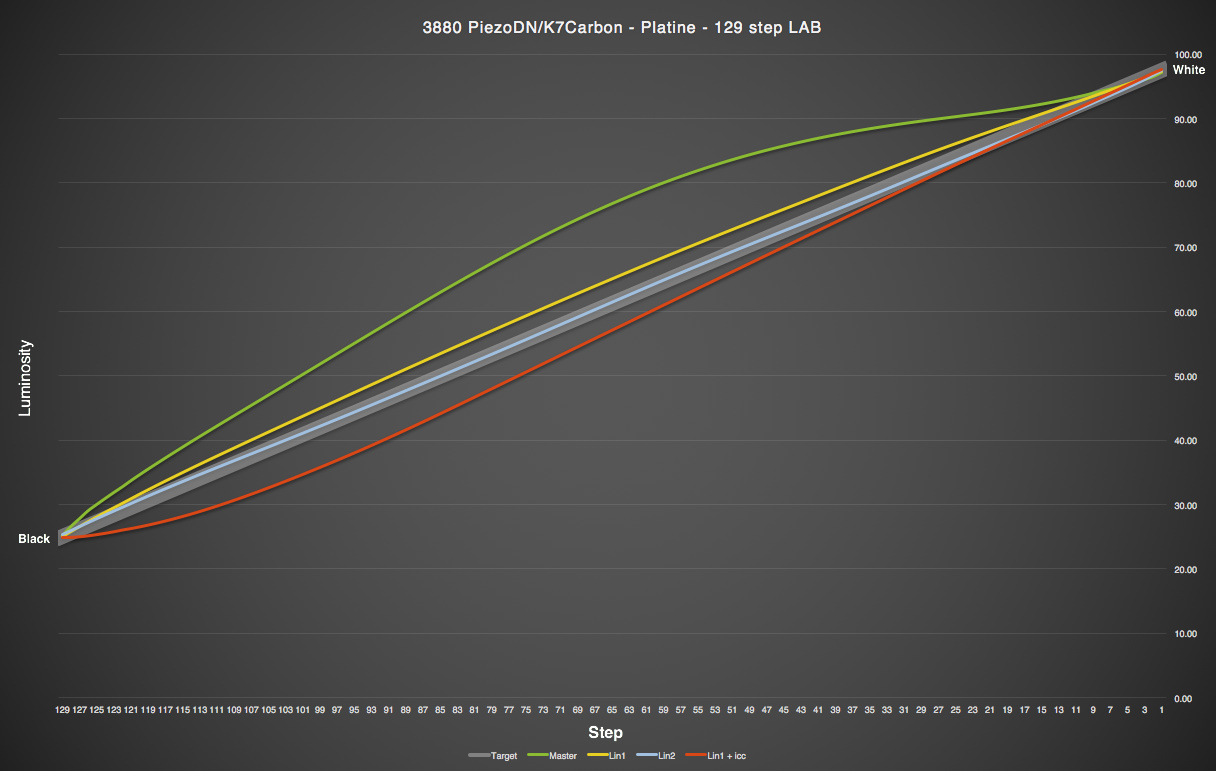
I often do a 2nd linearization just to see what happens, and sometimes a 3rd, but in the end it’s usually the first that I use. I found that if I print the linearized 129-step target neg again, and plot the result, that it becomes clear that their is a certain margin of error inherent in the printing process. We can tinker with these things forever and never get a perfect straight line.
That’s where the ICC comes in and can be very useful, especially if you like it’s “characteristic curve”. I use that term because it seems that regardless of what slight variations from linear a linearized quad curve may have, every one that I’ve used to generate a standard ICC using the QTR-Create-ICC app, produces a nearly identical result. I consider it to be the great equalizer. On the other hand, I don’t particularly like the characteristics of the standard ICC curve. In order to increase mid-tone contrast, it compresses the deep shadows. If you add something somewhere, you have to subtract if from somewhere else. So I prefer to not use the ICC, at least not the standard one. There is a way to customize the shape of the ICC output using the Curve Adjustment tool which has the potential to be very useful, but I have only dipped my toe into that. It could be something worth exploring though, when time allows.
Here is a graph that shows my typical master, -lin1, -lin2, and -lin1 with ICC results together. An ICC made with the -lin2 data produced an identical curve to the one shown.
[attachment file=28190]
I think that if you are going to use the ICC method for printing negs it is not necessary to do more than one linearization unless the first is way off. I do think it’s probably a good idea to make your own ICC though. It’s simple enough. I get the reasoning behind Walker’s suggestion that the supplied ICC is valid for use with any linearized quad curve though. Another approach could be to use one “master linearization” curve (which may be close enough for similar papers), and generate an ICC profile for each. Theoretically, this would produce the same result on each paper via the ICC rather than linearizing each paper and using one ICC.
To add to Keith’s talk about the Piezography Curve Adjustment tool and ICC, if you take the output of the curve adjustment tool and run this over QTR-Create-ICC (not QTR-Create-ICC-RGB) it will create an ICC that, when printed with, will act exactly like the curve you created in photoshop.
This is how you can build custom ICCs that tune your contrast to suit. Or you can apply the contrast adjustment directly to a .quad by dragging the output of the tool + quad over the QTR-linearize-quad droplet (as documented in the manual).
I have done both although for consistency I like to keep all .quads linear and simply change contrast with ICCs or in Photoshop.
For those reading this thread, we will be introducing a “linear icc” workflow with the new driver. So the day to day calibrations will happen in ICC (whether linear, custom, or standard ICC contrast) and the “media types” (salt, pt/pd, etc) will be linearized only once or twice over time to adjust to one’s individual darkroom and exposure situation (aka, platemaker vs fluorescent). This will greatly simplify the process.