Printing L* values

Hi there,

How can I simply print an L* value ?

I have a file in Gamma 2.2, say there is 3 patches in it :
L* = 45
L* = 60
L* = 70

How can I accurately print thoses patches ?

I tried to print from a linearized curve with no color management, but the black point shift and all the L* value are shifting accordingly so the L* values of my file aren’t the L values I get when printed.

It seems very simple but I can’t get it.

Best,
Frankie

Dear Frankie. The L* values of an image go from 0 to 100 while the L* values of the print go from ink black to paper white (aka, L* 13 to L*90.2)

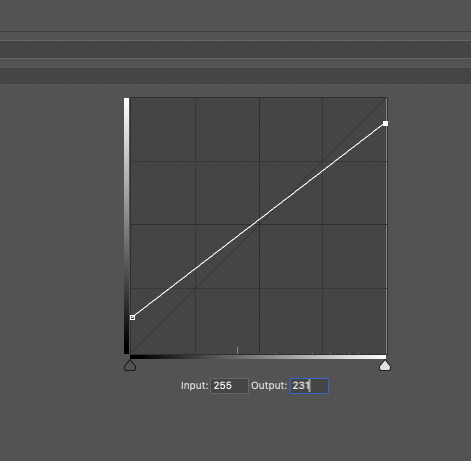
So these are different scales. You need to create a curve with the black and white point L* values as your start inputs for shadow and highlight and then use an eyedropper to view the resulting L* value.

example:

Lets say your paper was L13.5 for matte black and L 90.2 for paper white.

L* 13.5 translated into 0-255 scale is 35 roughly on the curve scale.

L* 90.2 translated to 0-255 is 231 roughly on the curve scale.

Screen Shot 2021-01-20 at 2.06.18 PM

Using an eye dropper it looks like L45 would be L49 on linearized paper,

L* 0 would be 14

L* 60 would be 61

L* 70 would be 68

L* 100 would be 92

That sound right? I’m just spitballing here.

best,
Walker

Hi Walker,

Thanks for your answer.
I can see better now (I’m a bit exhausted).

I’m okay with the curve correction that need to be applied on top of the file but is there a way to make a dedicated curve for this in the Piezography tool so that I can print accurately L values on a specific paper.
My idea is that it would be quicker than applying a curve on every file needed.
Is it possible to make a custom target in PPT that would take into account the L* values conversion ?

Best,
Frankie

Sure, you can use these measurements (for gloss paper) and set them in your “target measurement” sheet. Then any curve you calibrate will print with that “icc profile” screen to print match contrast when printing with no color management and gray gamma 2.2.

93.17
92.86229
92.52673
92.18993
91.85989
91.53216
91.20977
90.88483
90.5532
90.21747
89.88136
89.5489
89.21678
88.88441
88.55088
88.21651
87.88205
87.54821
87.21677
86.88806
86.56036
86.23203
85.90342
85.57638
85.25209
84.92971
84.60731
84.28407
83.96106
83.63993
83.32076
83.00191
82.68174
82.3602
82.03854
81.71839
81.4006
81.08483
80.76977
80.45432
80.13889
79.82496
79.51342
79.20354
78.89366
78.58294
78.27195
77.96178
77.65252
77.34294
77.0317
76.7186
76.40467
76.09143
75.77987
75.46971
75.15938
74.8475
74.53459
74.22273
73.9133
73.60549
73.29722
72.98758
72.67774
72.36951
72.06304
71.75655
71.4482
71.13789
70.82694
70.51677
70.20785
69.89951
69.59023
69.27876
68.96514
68.65039
68.3351
68.0187
67.69995
67.37834
67.05453
66.72978
66.40431
66.07696
65.74638
65.41245
65.07628
64.7396
64.40373
64.06873
63.73333
63.39623
63.05755
62.71875
62.38122
62.0449
61.70826
61.36985
61.02967
60.68902
60.34956
60.01223
59.67653
59.3407
59.00322
58.66427
58.32533
57.9872
57.64907
57.30926
56.96699
56.62296
56.27848
55.93374
55.58747
55.23819
54.88559
54.53072
54.1755
53.8215
53.46871
53.1153
52.7595
52.40173
52.04432
51.68888
51.33458
50.97923
50.62195
50.26422
49.90828
49.55455
49.20127
48.84647
48.48991
48.1329
47.77727
47.42402
47.07268
46.72137
46.36832
46.0135
45.65823
45.30319
44.94736
44.58875
44.22634
43.86099
43.49439
43.12679
42.75649
42.38143
42.00069
41.61502
41.22649
40.83724
40.44779
40.05649
39.66149
39.26311
38.86358
38.46448
38.06473
37.66156
37.25366
36.84258
36.43077
36.0185
35.60351
35.18344
34.75819
34.32968
33.89993
33.46941
33.03696
32.60077
32.15966
31.71431
31.26679
30.81919
30.37196
29.92359
29.47224
29.01717
28.55967
28.10309
27.6507
27.20313
26.75769
26.31155
25.86538
25.42293
24.9868
24.55549
24.1251
23.69372
23.26314
22.83602
22.41228
21.98893
21.56327
21.13546
20.70753
20.28102
19.85555
19.42964
19.00176
18.57122
18.13853
17.70477
17.27048
16.83529
16.39835
15.95923
15.51816
15.07605
14.63373
14.19107
13.74727
13.30185
12.85568
12.41148
11.97256
11.5403
11.11275
10.68757
10.26574
9.85158
9.44876
9.05723
8.67479
8.30138
7.94096
7.59849
7.27543
6.96958
6.679
6.40461
6.14977
5.91662
5.70529
5.51519
5.34492
5.1934
5.01199
4.85857
4.73385
4.63397
4.55834
4.50323
4.46355
4.44003
4.42758
4.41

I don’t have matte yet.

Thanks Walker,

It looks like theses values are not perfectly linear (for matching the screen I suppose?).

The values I need are for matte paper, could you explain me how to ge theses so I can calculate them ?
My black point is L* = 15 and my paper white is L* = 97,39.

What I need is that Lfiles = Lprint, not matching the screen (that’s for a scientific print (chart-based, not photography-based)).

Thanks a lot for your help !

Best,
Frankie

Lfile is never going to equal Lprint due to the nature of paper vs file but if you want dark-tone, mid-tone, and light-tone L* to match, than you can do this with a custom Target Measurement thing . . . not sure how to go about that but it’s doable.

-Walker

I don’t get the difference between your first statement (not possible) and the second one (possible).

If I match the light, mid and dark tones of the print to the L*of the file it’s okay for me, I mean in the range of the paper of course (don’t need to print L=5 on matte paper).

Quick questions about how PPT works : do we agree that the value number 128 of a 256 range in the target is the target value for the middle L*print of (paper white - darkest black) / 2 ?

I struggle doing some weird stuff (Gamma 1.0, linear reflectance and co…) as I don’t really know how the tool works in backstage.

Great, it’s doable if you don’t want to match the impossible blacks and impossible lights.

It actually needs to be divided by 2.56 (100 vs 256 steps).

So, 128/2.56 = 50.

best,
Walker

Perfect, that’s what I want.

Ok, is there a minimum number of values in the target panel ?

21 is the min

best,
Walker

Do you know where I can find L* values for each RGB value in Gray Gamma 2.2 color space ?

I think it’s ok, I just calculated it.
I copy it in case I’m wrong.

100
99,54420845
99,08589866
98,62503082
98,16156405
97,69545638
97,22666474
96,75514487
96,28085129
95,80373726
95,32375476
94,84085435
94,35498523
93,86609508
93,37413008
92,87903479
92,3807521
91,87922319
91,3743874
90,86618221
90,35454309
89,83940349
89,32069469
88,79834571
88,27228324
87,74243147
87,20871205
86,67104388
86,12934307
85,5835227
85,03349277
84,47915996
83,92042751
83,35719502
82,78935826
82,21680895
81,63943457
81,05711811
80,46973778
79,8771668
79,27927305
78,67591881
78,06696035
77,45224763
76,83162387
76,20492512
75,57197982
74,93260826
74,28662207
73,6338236
72,97400528
72,30694893
71,63242494
70,95019147
70,25999351
69,56156183
68,85461191
68,13884262
67,41393492
66,67955029
65,93532905
65,18088846
64,41582063
63,63969014
62,85203136
62,05234551
61,24009721
60,41471067
59,5755653
58,7219907
57,85326091
56,96858777
56,06711326
55,14790055
54,20992351
53,25205447
52,27304956
51,27153137
50,24596813
49,19464843
48,11565051
47,00680435
45,86564469
44,68935177
43,47467617
42,21784167
40,91441819
39,55915245
38,14573795
36,66649544
35,11191734
33,46999798
31,72521249
29,85688969
27,83647282
25,62257242
23,15115824
20,31338915
16,89432743
12,32846739
0
1 Like

Hi Walker,
Say I would like to match a curve with 256 L* values, ranging from 0 to 100, but my paper range is 15 to 98. (As a target, I already calculated the L* values I want for each printed RVB number).
What do you recommend to write in PPT for the top and the bottom of the curve ?
Do you advise to put the values that are not printable like :
“100, 99, 99, 98, 97[…] 15, 12, 0”

Or do you advise something else, like maybe :
“98, 98, 98, 98, 97 […] 15, 15, 15”

Do you delete the values that are not printable ? (I think this would not be good, because there will be less than 256 values and theses values will “spread” and slightly shift the target values.

What would be the best option to get the best precision ?
As you can imagine my target isn’t a linear curve :smile:

Best,
Frankie

fake numbers always increasing or decreasing. 15,15,15 won’t work.

best,
Walker

Ok so 15, 14, 13 ? Does 15, 7, 0, would give the same result or does the impossible values have an impact on the curve ?

only use possible values or everything gets funky

-walker

1 Like