Walker,
I’ve always wondered when “enough is enough” as far as linearization iterations go. I put that in quotes as I know the answer, is perhaps, somewhat subjective based upon one’s own expectations regarding linearization.
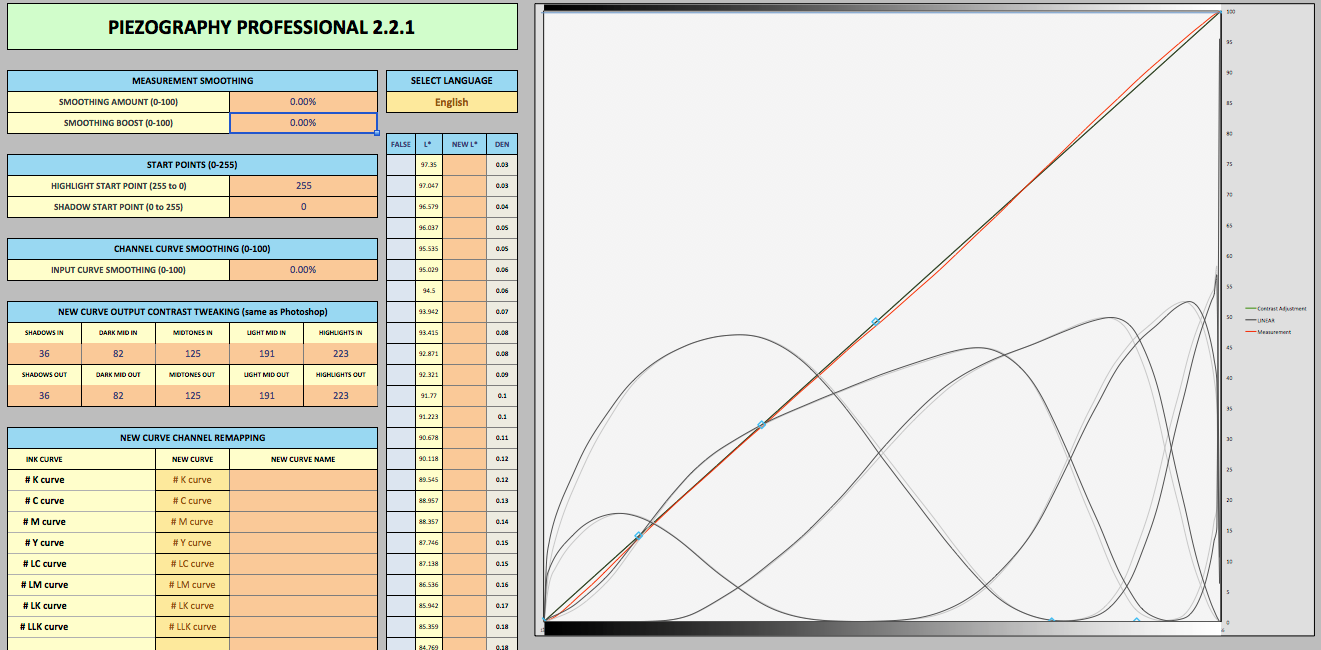
For example below is a screen shot showing the results of a 2nd linearization. (To be specific I first printed the starter .quad; this generated a first linearization; which I think created a 2nd linearization from and the results are shown here).
As you can see form the red measurements line in the graph it is “pretty” linear. I would say it is smooth (as I ran the measured data through the 129steps cgats smoother tool (=2) first before plotting.
Can or should this be linearized again (I actually did make a 3rd linearization I have just not printed it yet)? You can also see from the individual ink curves that this 3rd linearization varies only slightly from the 2nd linearization; but then again the red measurements also indicate this.
So that is why in the title I am wondering if there is a “guard band” around a perfectly linear result that is acceptable? I have seen other posts on this forum showing perfectly linear results. I also recognize that these prints (and in this case Pd.) is a hand made process with many variables.
thanks
Michael
For a dig neg (and even for just ink on paper) that is freaking great. A 2% change in humidity will bend the curve more than that so this is as good as you can physically get. It’s linear.
best,
Walker
Thanks for the quick reply Walker.
As an additional comment, FWIW, I have noticed that if i run my measured data through the CGATS smoother before putting it through the PPE tool suit I get “better” results; meaning fewer linearization cycles with better linearization. You may also have noticed that both smoothing values in PPE tools are set to zero %. I have noted your statement regarding over smoothing causing issues; and I’ve noticed that there really isn’t any visual benefit but using these two values. I also noted that running my measured data through the CGATS smoother tool also removes any reversals in the data (especially the first and last data points).
Just passing this along for other practitioners.
best.
M.
1 Like
Hello all,
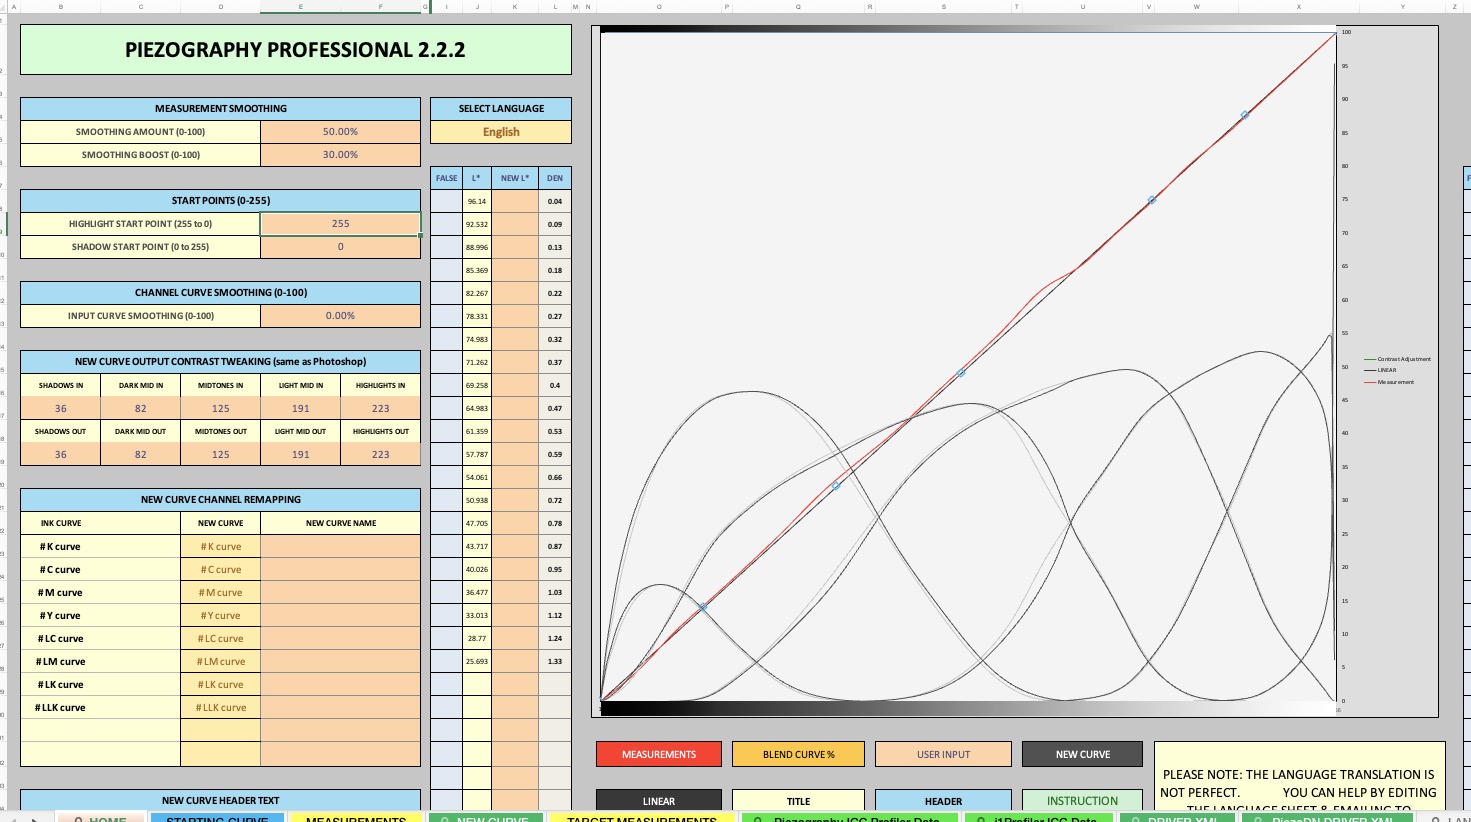
I’m restarting this thread with the same question. I didn’t get to the point that Michael did - my 2nd iteration is off by a bit more, but still.
The two screenshots below are:
2nd iteration PiezoDn neg printed in Pt/Pd. Environmental conditions are quite stable in my studio.
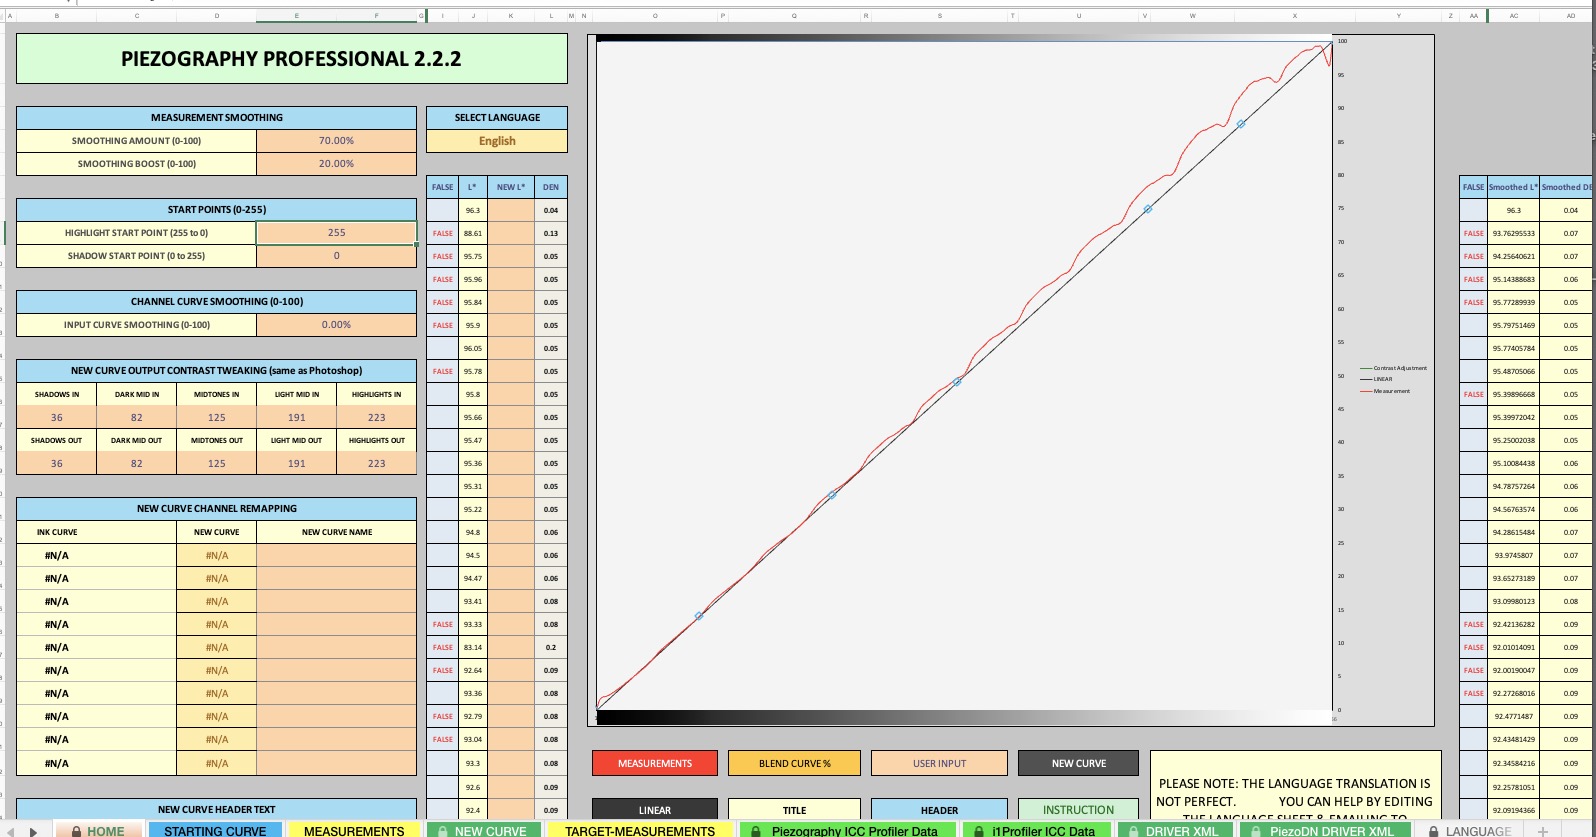
3rd iteration showing the results of a 256 chart with the same conditions, sensitizer, timing etc, etc
Should I have stopped at the 2nd iteration? Should I redo the 256 step chart and …?
Should I try the Cgats Smoother as Michael explains?
Thanks,
Mark
Dear Mark, go back to the 2nd iteration and print. No need for more.
-Walker