For some time already I had been quite puzzled seeing that the blackest blacks I obtained in my negatives with Piezo DN were not able to give me totally white - paper tone on my negatives. This same thing happened when printing the targets, and also happened under the totally black areas surrounding the negative image, printed with the inks, which covered parts of the paper where emulsion was put.
At the beginning, I thought it might be fogging… due to no restrainer (I am using Pt and Pd), or due to some particles of ferrous oxalate in the ferric oxalate, or some fogging due to ambiance UV light… I conducted a few tests and ruled out most of these variables…
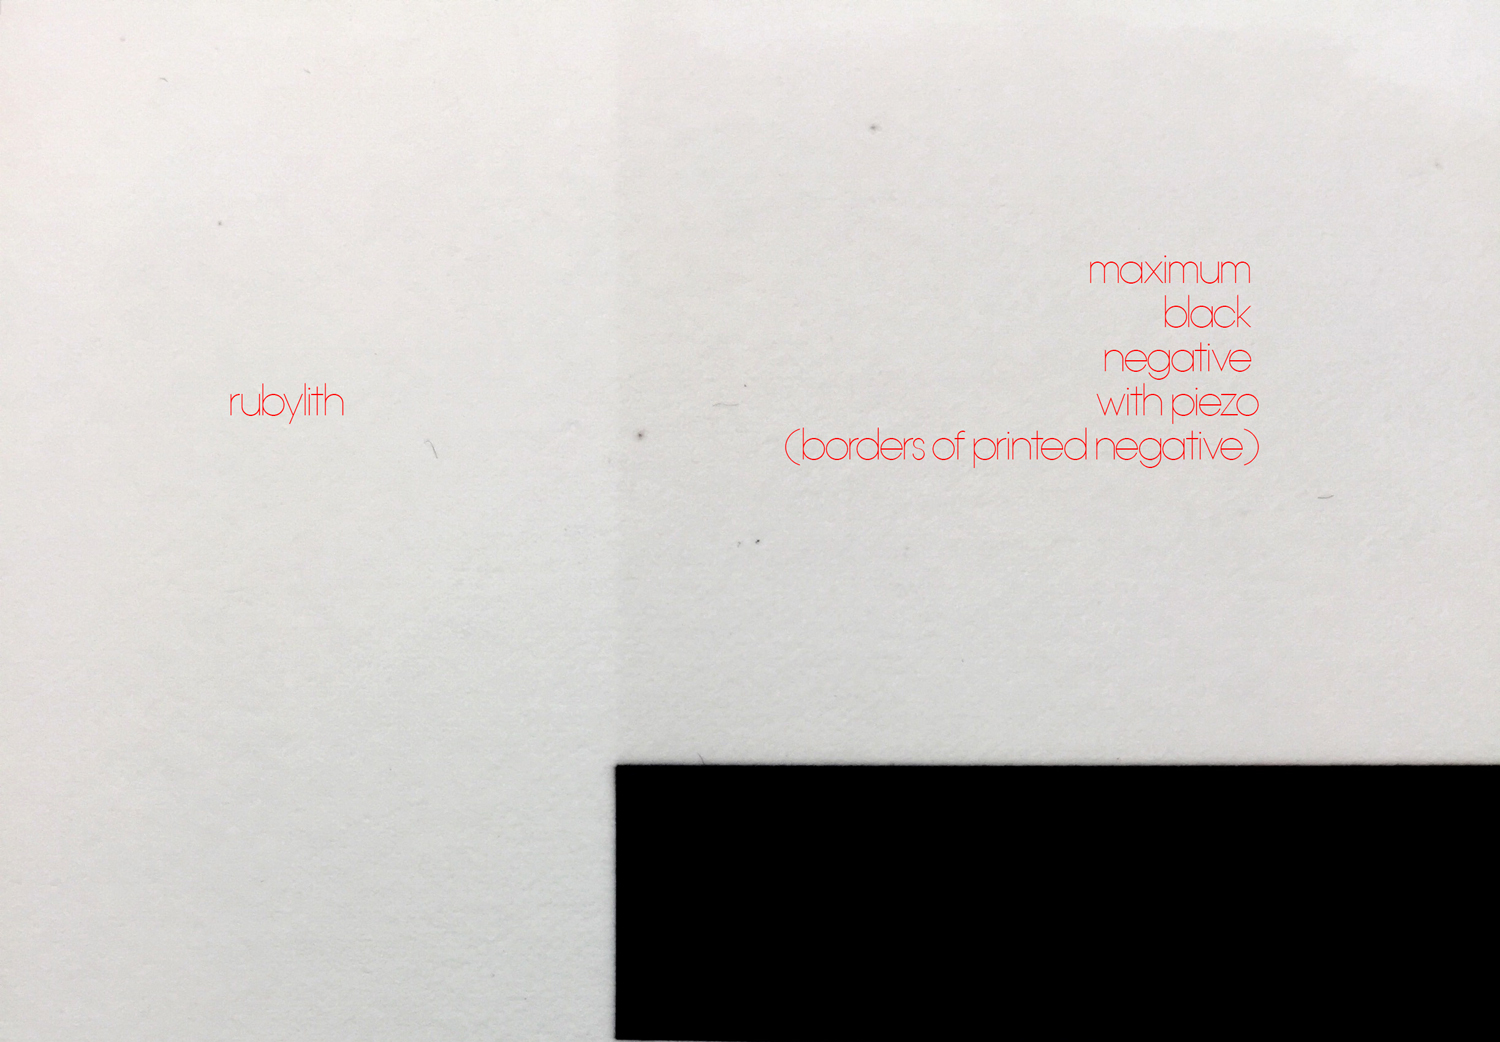
A few days ago I made a few tests with some Rubylith material (which blocks all UV in the platinum range) and I realized that my fogging was gone. I made a print by putting a band of Rubylith, and a band of PiezoDN negative totally black, and I compared the tones. I have to say that for the band of PiezoDN negative (printed on Pictorico Ultra), I used a band cut from the totally-black border I obtained when printing a negative of an image (that is, that black printed area which corresponds to the white border around an image). I understand, and you can tell me if I am wrong, that this black printed area corresponds to the Dmax of PiezoDN curves, right? I used the standard curves for Pd with no ICC to print this…
If I am not wrong, what this means is that the Dmax of PiezoDN (I am using the v 1.9 now) is not enough to block the light of my 4000 W Metal Halide burner, and what I am having is not fogging, is just that the Dmax is not strong enough to provide paper white in my negatives, or frames around negatives. As you can see on the image I attach, the difference with the Rubylith is quite dramatic. The rubylith is giving me paper white tone, comparable to the areas uncoated on the paper.
Is this finding normal? I am puzzled, because this might mean nobody out there is obtaining paper white in the negs? The problem does not seem to be related to my particular conditions…
Thanks so much in advance for your help and kind regards,
That’s really interesting Rafael. I haven’t had that issue with my fluorescent BL UV exposure unit. I suspect that it is related to your light source. I have been noticing from some threads here and in private correspondence as well, that the exposure light seems to be playing a fairly large role in tonal response of Pt/Pd processes. It seems to be fairly consistent that with the provided Master curve, exposure with fluorescent BL light bends light, while exposure with metal halide and/or mercury vapor plateburner light bends dark. This suggests to me that there is indeed a possibility that Dmax is not fully blocking exposure in step 1 where it should be pure paper white. This is fog - light fog, not chemical fog.
Given the way the entire Master curve is dark, it is also possible that you are overexposing. I have seen several examples where The highlight region descends very steeply, the mid-tones begin to flatten out, and the shadows are very flat approaching black from around step 80 thru 129. If this is the case for you, my first suggestion is to reduce exposure time by about 1/3. See if that has an effect on your white, but maintains the same Dmax.
The next step would be to modify your Master curve to account for the difference in spectral output/response. I just helped someone with this off-forum and would be happy to share the solution with you too if you are interested. What we did was to make a large adjustment to the Master curve using the Curve Adjustment tool. It seems to have done the job. Walker may have a more sophisticated way to accomplish this.
Finally, the added density that is supposed to be built in to V2 may also solve your problem.
PS - I’m starting to collect info on the specific exposure lights people are using. Do you know exactly what yours is make/model/bulb designation/etc?
Thanks for your kind answer… Yes, it would seem that I am not over-exposing, since a shorter exposure (I am giving 250 seconds) reduces the printed black. I am using an Heraeus 4000 metal halide lamp with the spectral response attached to this email.
The bands of what I assumed to be PiezoDN Dmax black printed negative were rebates from a printed negative (you know, the black borders around a printed negative). I printed those negative rebates with one of the first versions of Piezo DN, using the standard curve from PiezoDN - 9900 printer - Pd only with no ICC.
I think some other people using Metal Halide units were experiencing the same problem… and in fact Walker said they had developed a special profile in-house for using their Metal Halide lamps. Can I assume the first profiles of PiezoDN were optimized for BL tubes, and not for the powerful Metal Halides?
If Metal Halide lamps need more density, can we as users obtain that extra density in the negs by means of adapting the curves? Do we need to start with a Master curve, limit it and then linerize? Tell me if I am wrong, but I suppose linearizing is not the solution to increase the Dmax, since we want to tweak the first patch of the target only (blackest black), not the distance between the subsequent tones…
I think we need Walker to step in and let us know :
Whether can as users do something to increase the Dmax of the first patch to make sure we obtain paper white with Metal Halide lamps
Whether the PiezoDN 2.0 version will come with standard curves optimized for Metal Halide lamps
Without the possibility of making sure I obtain paper white with the blackest patch, I am really at a deadend, because not matter how much I linearize, my highlights will always be a bit grey…
I would rather avoid changing my chemistry (for instance, using restrainers) since what I love about the digital negative idea is the fact one can tailor the neg to the chemistry, and not the other way around. I have to say in any case that I love PiezoDN, I am just still climbing the learning curve!
Thanks for your quick answer… That is great news. Do you know however what could be wrong with my results? I would like to understand whether there is something I was doing wrong or whether it might happen for Metal halide lamps to pass through “before-v2.0” printed negs?
What Keith mentions is really smart, but unfortunately I do not have a transmission densitometer… so I cannot know exactly which is the density I was having.
I made a few assumptions however that I hope are true:
Those bands of total black neg corresponded to the “frame” or “rebates” of a printed negative, using the curve <span style=“color: #222222; font-family: arial, sans-serif; font-size: small;”>79-99-PiezoDN-80pd20pt-Ox.</span><wbr style=“color: #222222; font-family: arial, sans-serif; font-size: small;” /><span style=“color: #222222; font-family: arial, sans-serif; font-size: small;”>quad.</span>That is, that black corresponds to the left overs of a negative that are printed black because the frame around the original file was left white. I assumed the curve would be printing this at the Dmax available with that curve, right?
I used Pictorico Ultra on Epson 9900, with the PiezoDN inks…
I made the tests with a smaller amount of Pt than 20%, just in case that can have an influence (the curve was made for 80 and 20%). I know Pt increases the contrast, so maybe the fact I was printing with less contrast that the curve was made for has a certain influence? That being said, I would not have expected such a difference in terms of fogging in the final exposure…
I exposed at the standard time of exposure, calculated so that I obtained the maximum black with the minimum amount of exposure. I made these tests a few times, so I am pretty sure about that value.
Based on this:
Questions:
Have you got any idea why I might be having these problems? is there something I might be doing wrong?
Is there any way for the user to “tweak” the Dmax of a certain curve? I know we can limit a master curve (which is just the opposite, making a neg thinner) or linearize a certain curve (which to my understanding only changes the values in between black and white)… so how to change the Dmax?
When you say the version 2.0 doubles the Dmax, does that mean it is automatically raised on all negs we will print with those new curves? The user has nothing to do? Therefore, the areas of the neg corresponding to pure white will print automatically with a bigger Dmax?
If I want to test the blocking power of the new 2.0 version, I suppose I just need to print an image composed of pure white by using the new v 2.0 79-99-PiezoDN-80pd20pt-Ox.quad, and then I should be obtaining a neg with the maximum density of… 4.6?
Sorry to be bringing you trouble! And thanks so much to Keith and you for your support… You are a couple of angels!
1) Have you got any idea why I might be having these problems? is there something I might be doing wrong?
Nothing is wrong. With some printers in the x900 class I've seen dMax drop from 2.7 to 2.5 based on the print-head used. There is some variability there that the v2 curves are meant to address.
2) Is there any way for the user to “tweak” the Dmax of a certain curve? I know we can limit a master curve (which is just the opposite, making a neg thinner) or linearize a certain curve (which to my understanding only changes the values in between black and white)… so how to change the Dmax?
The dMax is only the last patch. If you increase the number just below "# K Curve" in the .quad file using txt editor you will get more dMax but also possibly over-inking. We made special tweaks in the v2 curves to enable both higher dMax and not over-inking.
1) When you say the version 2.0 doubles the Dmax, does that mean it is automatically raised on all negs we will print with those new curves? The user has nothing to do? Therefore, the areas of the neg corresponding to pure white will print automatically with a bigger Dmax?
Yes. The dMax is doubled only in the last patch (white highlight). It requires a re-linearization from the base curves. It will not magically up the dMax on curves you have linearized all-ready.
3) If I want to test the blocking power of the new 2.0 version, I suppose I just need to print an image composed of pure white by using the new v 2.0 79-99-PiezoDN-80pd20pt-Ox.quad, and then I should be obtaining a neg with the maximum density of… 4.6?
Yes. It will probably be around 4-ish on your printer.
What do you mean by “<span style=“color: #222222; font-family: arial, sans-serif; font-size: 12.8px;”>It requires a re-linearization from the base curves. It will not magically up the dMax on curves you have linearized all-ready”?</span>
I remember you send the link to a set of curves used for metal halide units internally at Cone Editions… were those also intended to increase the Dmax for use with metal halide? I suppose this v2.0 overrides those curves you sent ?
The curves in v2 are starter curves and must be linearized. The install procedure will not change curves that have already been created, but instead will replace the starter curves with ones that have been built for higher-dMax.
The Cone Editions metal halide curve also increases dMax, yes.
Ok, that is what I thought, thanks for the clarification…
<span style=“background-color: #fbfbfb; color: #5b5b5b; font-family: sans-serif; font-size: 15.6px;”>The Cone Editions metal halide curve you provided “unofficially” was built for being used on 9900 printers, or a different model? Was it made for Pd only? Do you think I would benefit of using it for any reason for my Metal Halide exposure unit, now that the v2.0 curves are released?</span>
I am the one Keith helped recurve the Master profile, and he really got me out of a bind. I was actually almost ready to throw the towel. I am using the same lamp as you do, except that mine is a 1500W. But based on the spectral response you posted an image of, you are using a gallium-doped bulb. Like you, I got a very contrasty 129-step, and linearizing it created smoothness issues. I was about to give up until Keith stepped in and suggested creating a new Master profile more adapted to my bulb. And the result was even better than hoped, being very close to linear. However, I do not have any issue with light fogging, which to me suggests you are either over-exposing or there is a problem with the ink.
First issue: light fogging. Keith suggested I reduce my exposure, and while I was fairly confident of my long-established exposure time, I was able to reduce my exposure by 1/3 stop. The past couple days I spent recalculating my exposure time for the various papers I use by exposing a transparency and gradually masking it with rubylith. If I am not mistaken, 1/3 stop of 250 sec would be: 198 / 157 / 125 / 100 / 78 / 62 / 50 / 39.
The second thing I would do would be to check the transmission density of the dmax of the negative. If I remember well, I’m getting well over 4.
In regards to the Master profile, I was getting too much contrast. Keith showed me how to create a new Master profile based on my initial results.
If you look at the graph below (again thanks to Keith), the green line is the Piezo DN master profile at my initial standard exposure time. The yellow line was with an exposure of 1/3-stop less. The blue line is the new master profile. I’m still trying to linearize. The red line is my first attempt. I’m doing a second one as I’m writing this.
I can send you the new master profile if you would like to give it a try. It would be great if Walker could provide different master profile based on the light source. As I mentioned above, I tried linearizing from the provided Master profile, but it necessitated several iterations, which created issues with smoothness.
I started writing this yesterday and looks like I missed some conversation in the meantime. Thanks Walker for the new curves. I will try the new Master provided. Just to be sure, the x8-P2-PiezoDN-Master.quad was created with the metal halide source?
The new curves are not built for Metal Halide. This will come in a later version. They are the same densities as the normal curves but with increased dMax of the last patch to enable no fogging in extreme environments.
In order to release metal halide specific curves, I need to think it through and document properly so-as not to confuse people.
If you are seeing measurement “noise” in the process of building a master curve for a platemaker that does extremely dark prints, I suggest to first TUNE the original master curve using the Piezography Curve Adjustment tool to bring the curve/print to a point where it’s nearly linear. This Piezography Curve Adjustment tool will maintain algorithmically smooth tonal transitions. Then the final calibration can then be done with your spectro with higher accuracy.
Thanks Gilles, Keith and Walker for all the contributions.
I see Gilles what Keith said on his post… Thanks for your thorough answer. Your idea (and I think also Keith mentioned it ) of creating a certain library of master curves for different light sources could be really good… We users could provide certain curves with the specifications we used to create them.
For what I have seen on the documentation, my bulb is a Metal Halide bulb for micro-film (Z1). I have not seen such a big difference in terms of linearization, but mainly the problem with the fogging… I was using the Stouffer 21 method to calculate the exposure time, but I think I am going to perform the old-style technique of the test strips with a band of rubylith… Who knows, maybe I am over-frying the negs. In any case, I am going to try with the new v2.0 and see what happens with the last patch which now I expect to be pure white.
Walker, I know you have a million of things to do and this is opening a door you might not want to open yet, but for those who are using metal halide platemakers (like me), what is what we can expect once you will release the “special-for-metal-halide” curves? Those profiles will have an increase of density not only on the last patch, but also all along the tonal range? The internal curves Metal Halide Cone Editions you leaked on a different post were made for which kind of printer? Could we use them for a 9900 printer as a Master file to start with and expecting eventually better results than with the v2.0? Maybe before the official release of the curves for metal halide you could do an unofficial-soft-launch for those who want to start playing with them? I do not know which is the proportion of users using metal halide vs BL fluos… but if we are a minority, maybe you could go with an off-the-grid version of curves as a helping hand?
If I understood well what you explained to Gilles, you propose to start with a Master Curve and then pre-tune it with a curve using the Piezography Curve Adjustment tool to cover the big gap and only then making the standard linearization, right?
Thanks again, I hope I will be able to give back to the community all the help you are providing here…
What Walker has described above, using the Curve Adjustment tool to modify the Master for the different output characteristics of metal halide bulbs, is exactly what I suggested to Gilles in our private conversation, and what he has demonstrated in the graph above. I made a guess as to what the curve should look like simply by looking at where it needed more ink density and shaping the curve to put it there. (The same way I did this in the prehistoric days of digital negatives!)
The yellow line (reduced exposure) did improve on the compression of the lower mid-tones and shadows. I would try reducing exposure further until you actually start to lose Dmax. I realize you may have determined this already.
The blue line (curve adjustment - new Master) got even closer to linear than I expected. A lucky guess.
The red line (first linearization) is weird though. That looks like what you would expect from an ICC, not a linearization. Maybe a fluke in printing?
I understand yes… that would be really useful. What I am going to do is to try after Christmas the new v2.0 curves, rework my exposure time (by using the test strip rather than the stouffer) and see what I obtain in the end when printing the target with the master curve. I suppose you would recommend to start with the IJM curve for Pd only (even if I add a bit of Platinum), right?
You are an angel Keith, it is such a wonderful thing to see people like you helping others like you do…
I thought it was a flux as well, so I reprinted it and got very similar results. I went from almost linear to too dark. A second iteration did the opposite, now it’s too light. I’m just running in circles… I don’t really understand why…
Rafael - If you mean the Master Pd curve then yes, that’s where to start. The addition of a small amount of Pt isn’t going to have a large effect - it may lighten the highlights slightly. You may need different linearizations for different Pd:Pt ratios if you want them to be absolutely linear, but the same Master should be good for both.
Gilles - That’s weird, but I’m getting some weird stuff too with this vintage Gampi Torinoko I just got. Two days ago I made a first linearization that was nearly perfect, but I decided to do a 2nd just for fun. It was also a little weak in Dmax. This paper, both the newer version that I got last spring and the little bit of old stock I still have from 10+ years ago, has been producing Dmax near 1.50 regularly. This time the Master and Lin1 were both around 1.35, so last night based on our email discussion yesterday I decided to switch from the “kryptonite” ferric I’ve been using since mid-summer to B&S to see if it made a difference. It did. Dmax is back up to 1.5ish, but it also has a slight fog. The unexpected thing is the shape of the curve changed with the Lin2 neg. Unfortunately I changed 2 things so I’m not sure which is the primary cause. So I’m now making some fresh B&S ferric and will redo the tests starting with the Master. That is a long way of getting to the question: Is it possible that you changed 2 variables?