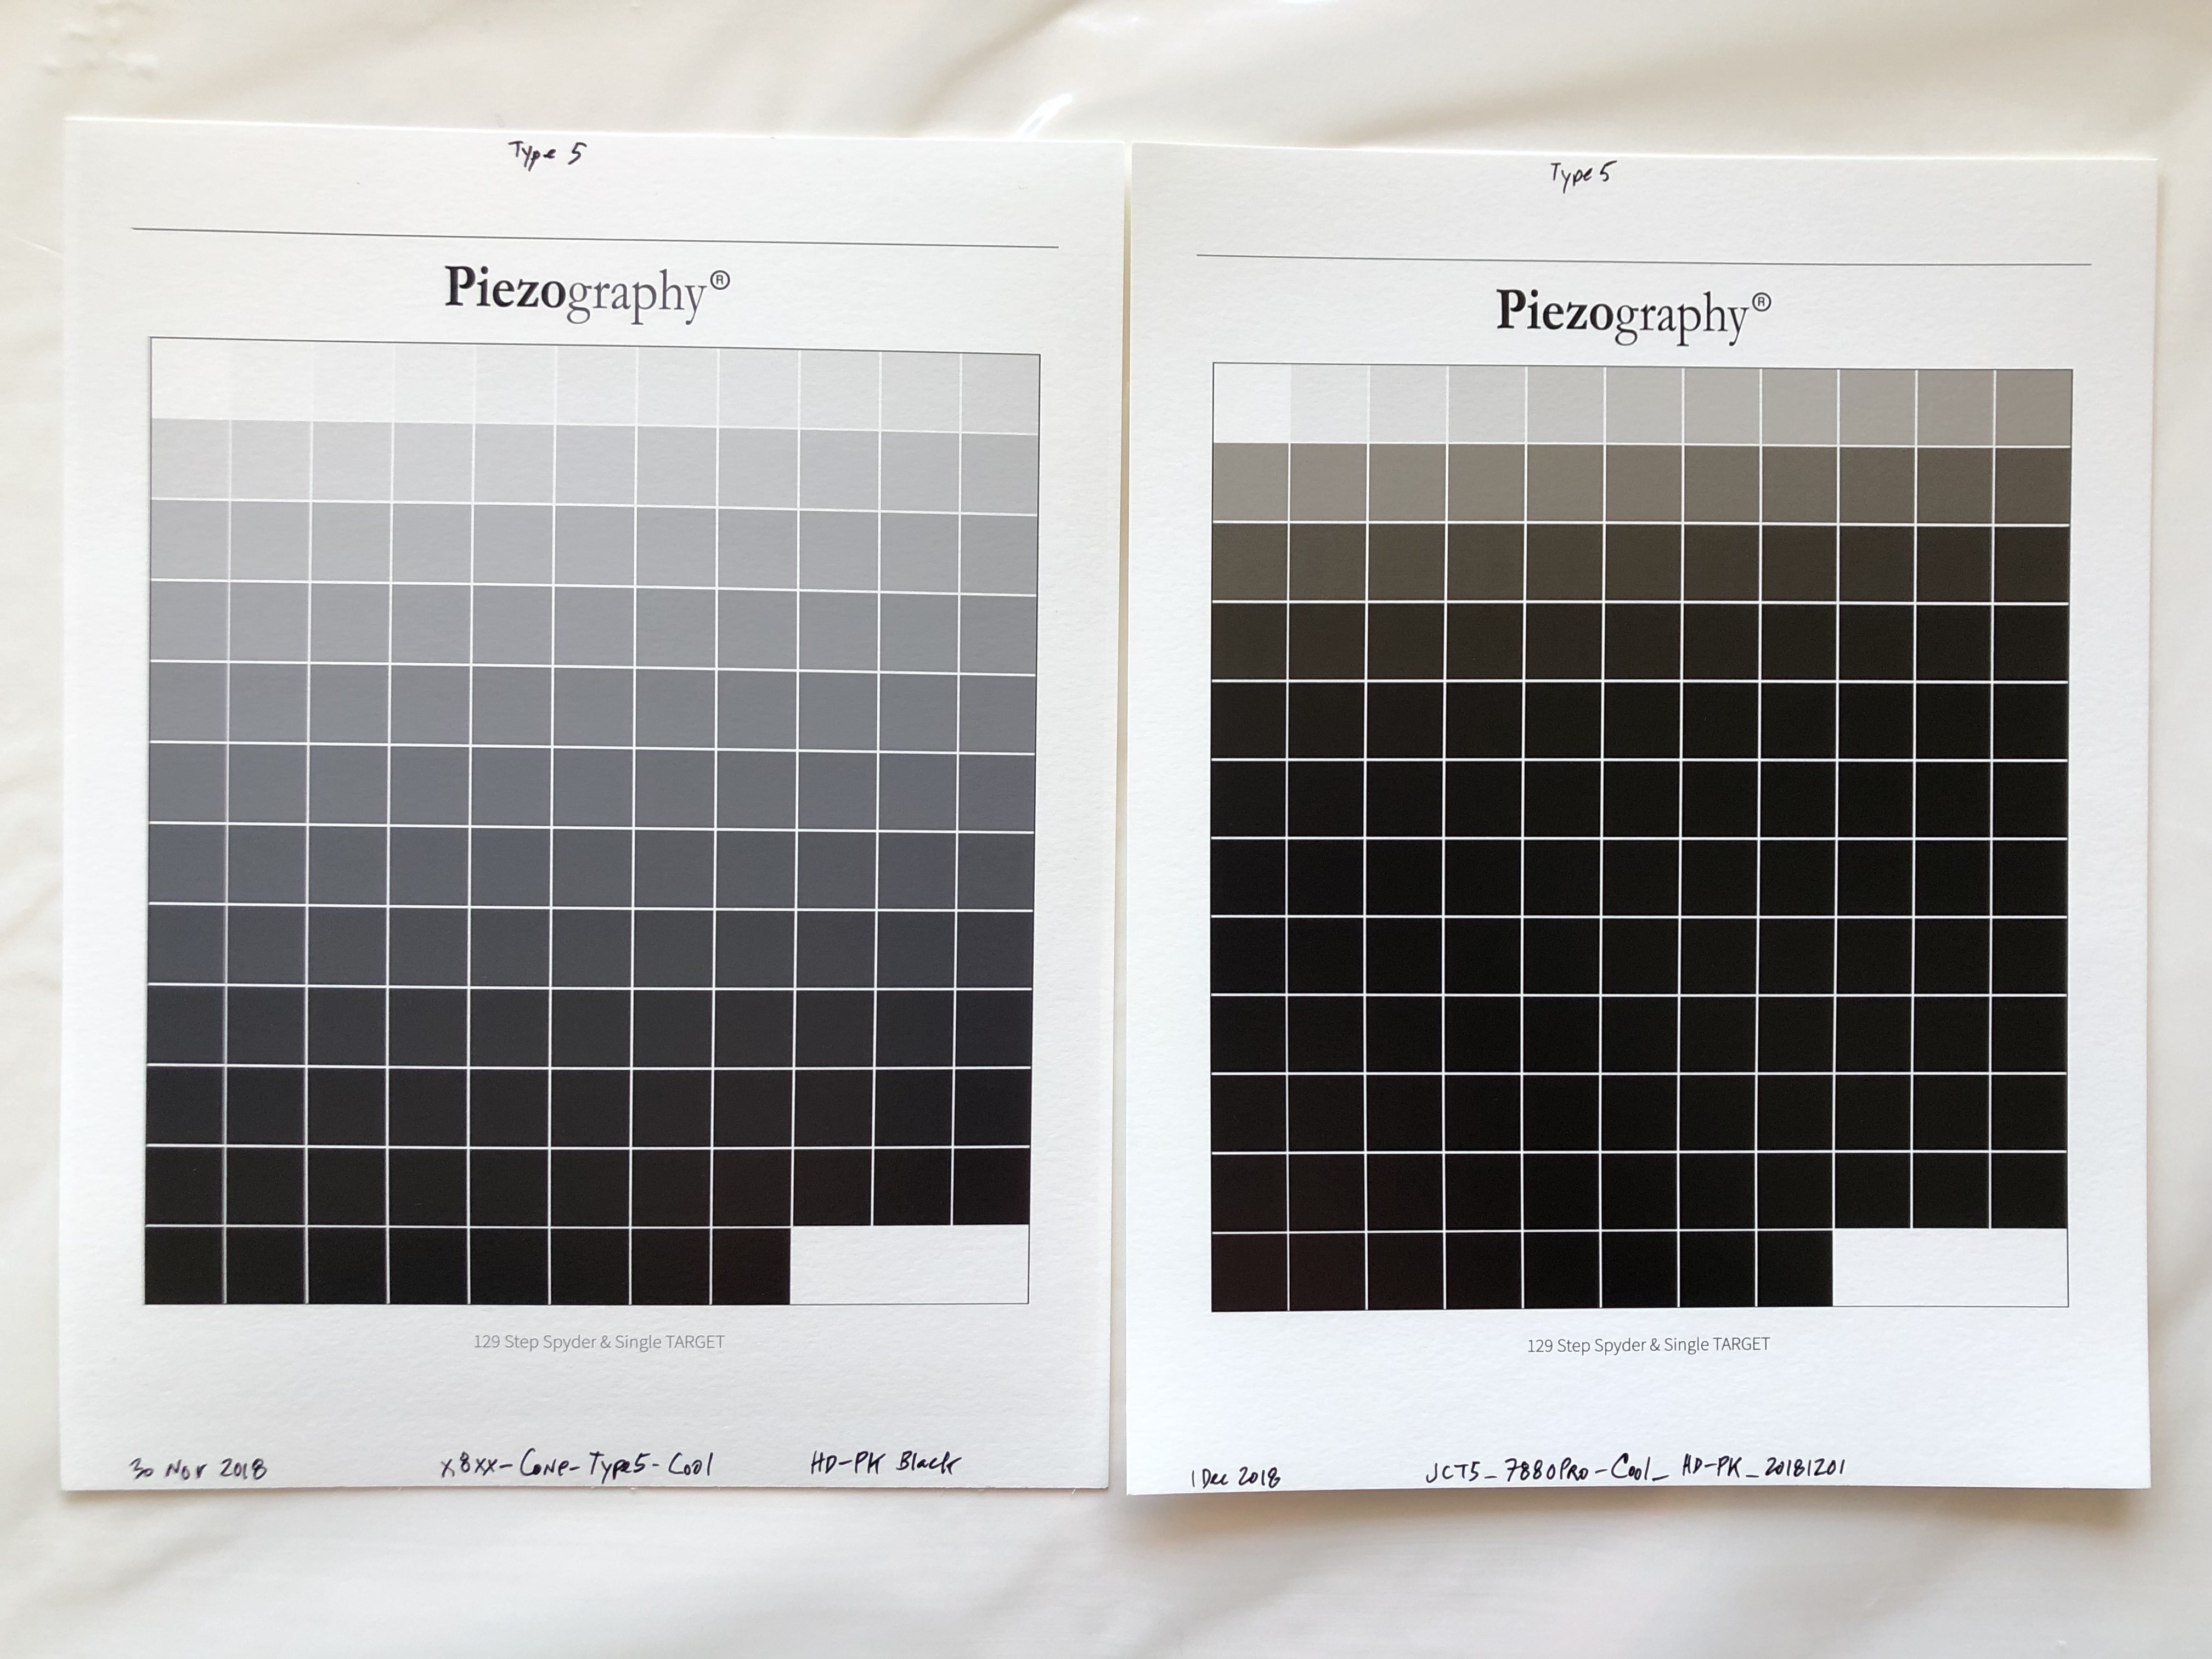
The image on the left is the 129 Spyder target printed on Type5 paper using the x8xx-Cone-Type5-Cool curve. The image on the right is the same 129 Spyder target printed on type5 paper using the linearized curve (JCT5_7880Pro-Cool_HD-PK_20181201); this curve has not yet been measured. The linearized .quad was built using PPTool v2.0.3. Printer is 7880, Pro inks installed w/ HD-PK and GCO.
Here is the measurement data from the left image:
JCT5, x8xx-Cone-Type5-Cool, HD-PK, 2.txt (2.1 KB)
Here is the .quad created from the linearization workflow (reference image on the right above). Smoothing amount = 80%; smoothing boost=25%.
JCT5_7880Pro-Cool_HD-PK_20181201.quad (4.2 KB)
I have not yet measured and plotted the image on the right (printed with the linearized curve JCT5_7880Pro-Cool_HD-PK_20181201.quad).
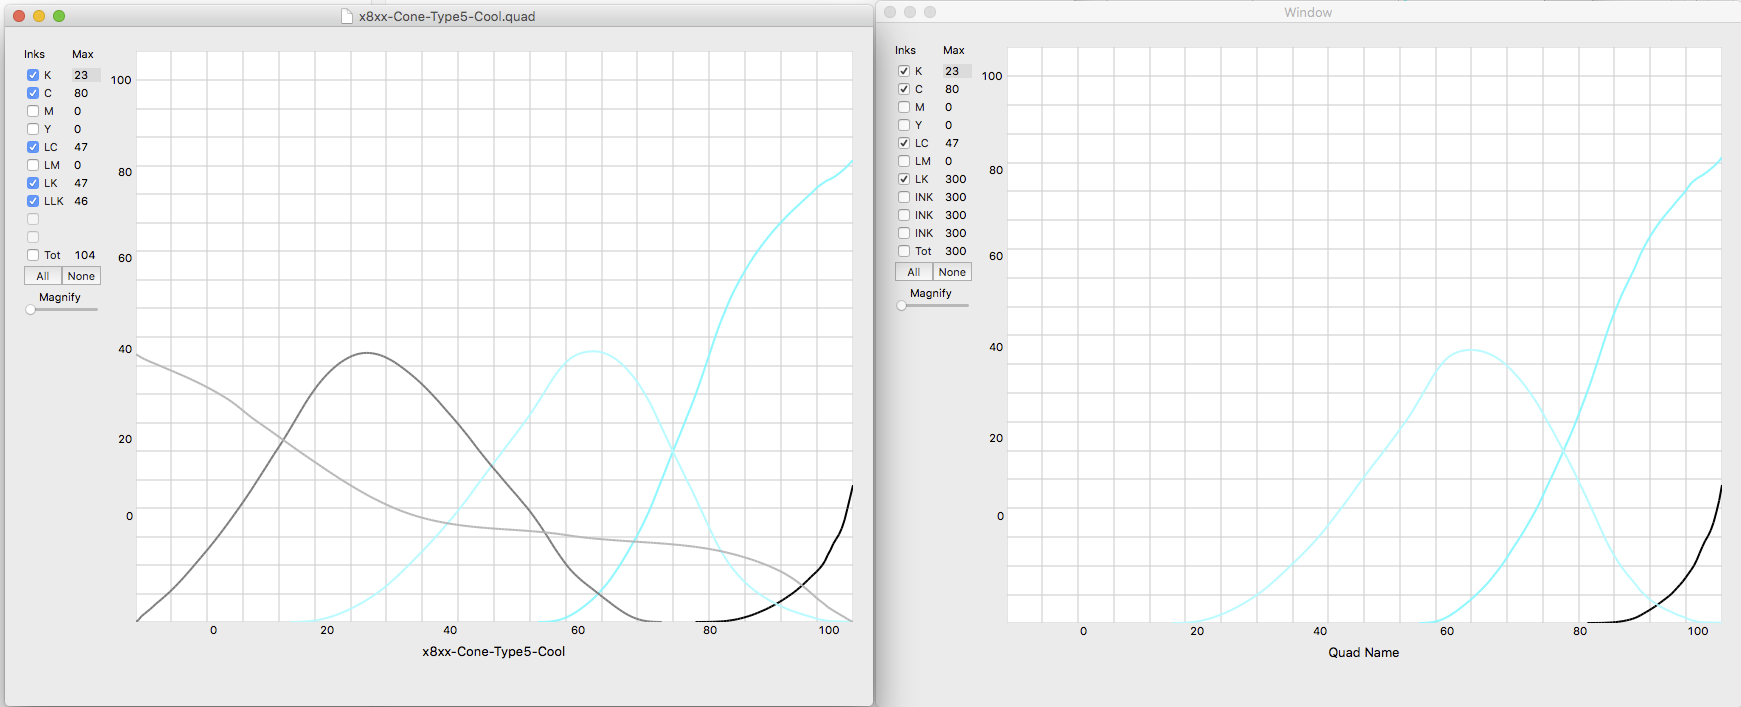
Here are the two .quads opened in QTR-CurveView. It appears that the linearized .quad did not print the GCO (LLK channel) - visually examining the print confirms this.
Another odd thing is that the linearized .quad CurveView has LK=300 and yet it does not show up in the graph.
Here is a screen shot of the two .quads in QTR-CurveView:
OK, what did I do wrong?