Hi Walker,
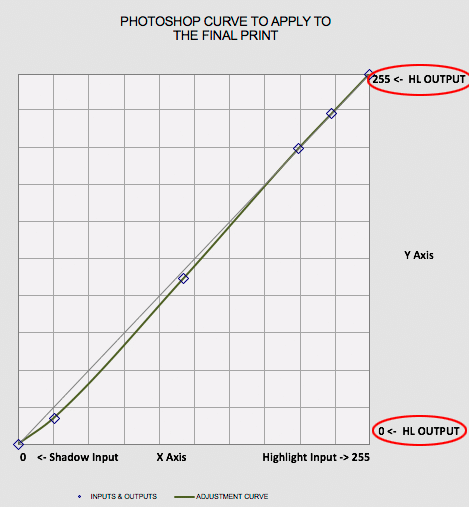
As I’m getting ready to use the Curve Adjustment tool for the first time, I noticed that on the Y-axis both 0 and 255 are labelled HL Output. I’m sure one of them is supposed to be Shadow Output. Since the title of the graph says “to apply to the final print”, I think we are still working in positive space, and therefore it is zero that represents shadow output. Is that correct?
Wait. At first I thought you were correct.
But no. This is actually inputs and outputs. So the labels are correct but maybe confusing. I will simplify it.
W
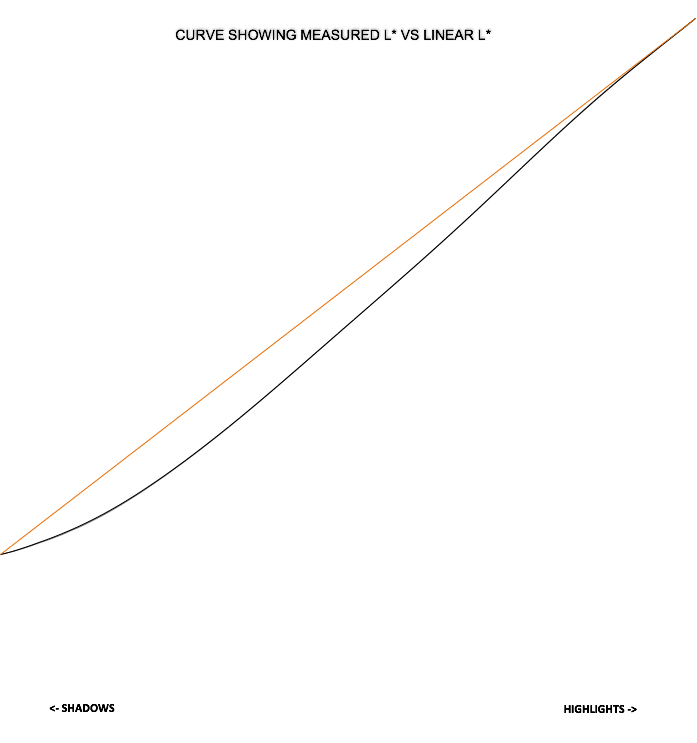
I mustn’t have been clear in my description. It can’t be right that both 0 and 255 on the Y-axis (output) represent the highlights! One of the circled labels has to be the shadow end. It matters as far as how to go about adjusting the curve. For instance, I want to diminish, but not eliminate, the shadow compressing effect of the icc that I just made. What I have done here is to approximate the curve representing the result I get with the icc, and then move the shadow area closer to linear without moving the highlights. I’m guessing of course, since it is a different number scale.
[attachment file=992]
[attachment file=995]
Yeah. The output is simply Y axis.
What you did was perfect.