Hi Walker.
You sent me some curves for a doped mercury lamp and they work a lot better as a starting point for linearisation.
However there is some density in the lightest part of the negative so I’m not getting the possible max black on the prints.
The curve I’m using is 3880-PiezoDN-CEP-HPR-OX-170606.quad (8.3 KB)
3880-PiezoDN-CEP-HPR-OX-170606.quad
I don’t get this density with any other curves, so I suppose there is something in this curve. The density is still there after linearisation.
I print on a 4800 printer but you told me I could use this curve anyway.
Best,
Johan
Hi Walker.
Have you given up on me ?
(Just kidding)
I thought I might clarify a little. When I print the test target, the parts of the negative supposed to be 0% still have som density in them.
There is an ink pattern in them, instead of being completely clear.
So when I messure the printed test target I will get like 1.32 in the areas of clear film and around 1.28 in the darkest parts of the test target.
It is clearly visible to the eye.
Best,
Johan
Dear Johan. So sorry for the delay, I had type out an answer immediately after seeing this post but it seems to not have made it. Thank you for emailing and letting me know. Usually I check the zero reply list regularly but this was a double-post so it didn’t clue me in.
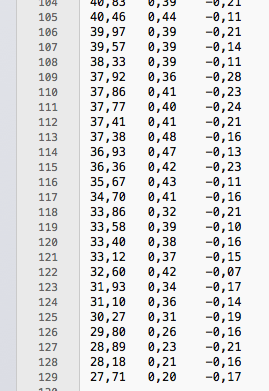
Short answer: PPEv2 has an “auto dmax limit” feature. Basically if the last few values of measured density look something like this:
29
28.4
26.5
23.3 <-- this is the lowest value)
24
23.4
the software will fog the film so that for your given exposure it will print the 23.3 density. So it corrects for overexposure and reversal automatically. However, if this is just an error of measurement (it usually is) you need to look at the “falses” column in the PPEv2 software and you will see it show as a false. Then just manually change it to something like 25 (in this example) and your film will not be fogged. As long as the last number is the lowest number you are ok.
So input your measurements and the original curve and look for that lower value false down at the bottom of the falses column.
best,
Walker
Hi guys,
I don’t think this has anything to do with software fogging the film to compensate for overexposure. Unless I’m misreading something in the original post (always a possibility), Johan is talking about the result of a curve supplied by Walker, not a linearization he has made from that curve.
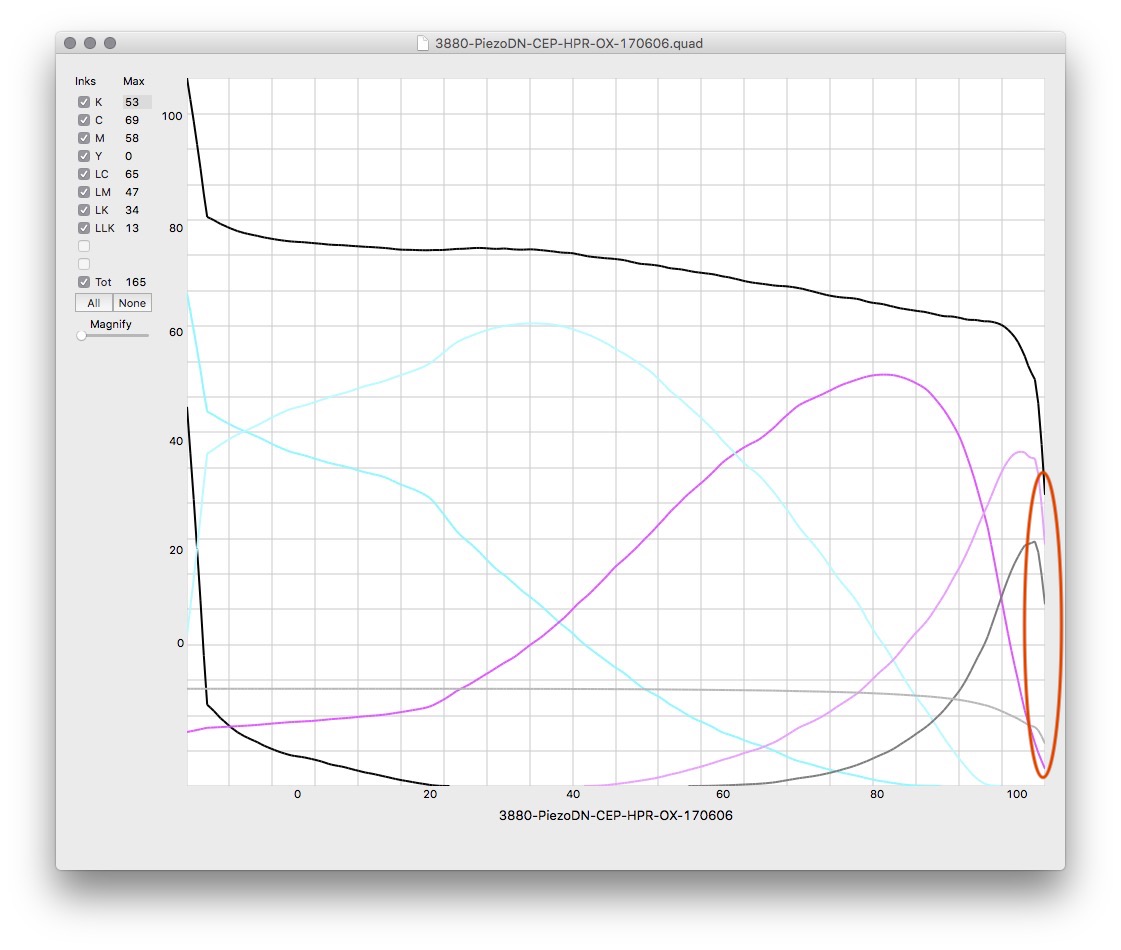
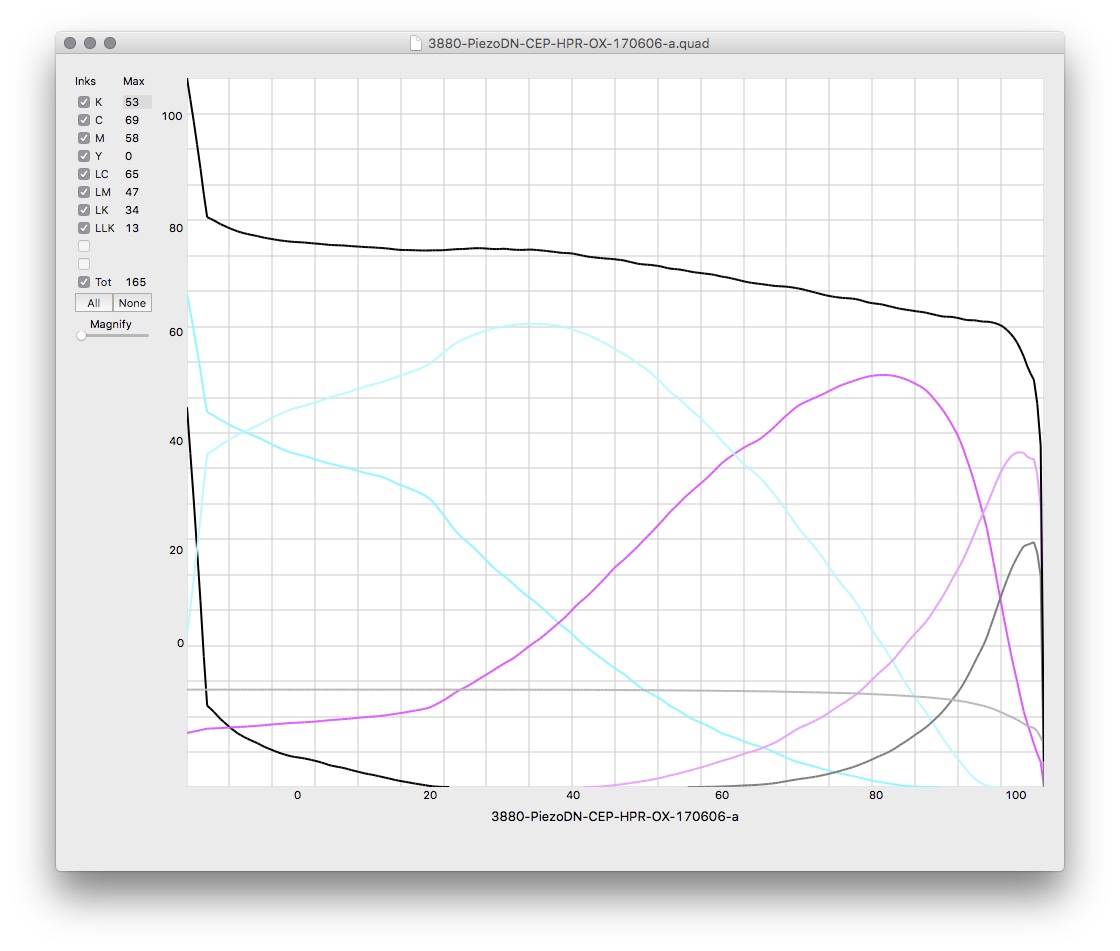
Take a look at the curve Johan posted above (3880-PiezoDN-CEP-HPR-OX-170606.quad) in CurveView or PPEv2. You will see that rather than all channels tapering down to zero at the shadow end of the tonal scale, the M, LM, and LK channels all still have substantial ink being laid down. That is why there is tone at the shadow end of the negative.
I do remember vaguely that Yanis was intentionally adding tone to the thin end of his negatives but that was for something specific he was trying to accomplish in gravure so those negatives were actually positives, and anyhow it is irrelevant to this which appears to be Pd in K Oxalate on HPR. What is CEP? The lamp?
Cheers,
Keith
Look at the numbers keith. This was auto-fogged. This was not a master curve but one he was creating.
best,
Walker
Help me out here please, Walker. (And sorry for the misdirection and hijack.)
Apparently I was mistaken in my inferring that the curve Johan posted above was not one that he had generated rather than the curve he referred to as being supplied by you for a doped-mercury lamp. (I also apparently misinterpreted the numeric part of the file name, 170606, as a date.) But in 3 plus years of reading and discussing everything (or almost everything) you have written about PiezoDN, I have never come across the term “auto-fogging” or reference to it by any other name. And you may remember that I have not been reticent about expressing my thoughts about the problems and difficulties caused by habitual over-exposure which is sadly common among the Dmax obsessed trying to squeeze every last bit of black out of a printing process. I have also guided more than a few out of the darkness.
In the past you have always been emphatic about the first and last few measurement values being in the correct descending order, and not leaving it to the software to try to correct for it, but manually fixing them if necessary. Of course this does not apply to the main mass of measurements, only to the beginning and ending few.
If the problem is due to a measurement error, there would be no visible reversal, and rereading the steps in question should give values in the correct order. If it is due to over-exposure, the best practice is to find the correct exposure and redo the target print at that exposure.
Why would someone want to use this “auto dmax limit” feature rather than establish a proper exposure time? Have you documented this anywhere? I can’t find any mention of it.
Cheers,
Keith
Admittedly this is a non-documented “feature” that only rears its head when/if the last few descending values are not properly corrected for falses (aka, burned in shadows) as I harp about a lot.
There are two (lazy) reasons for the feature.
- Don’t waste metal on a second calibration with the proper min-time for max-black, just calibrate with fog and print.
- standardize 1 (fairly long) exposure time for all processes during a workshop with the processes that are prone to reversal (Pd/Ko,etc) fogged properly. This way the 10 students only have to remember 1 exposure time.
In reality it’s one of a few things that may be extraneous to real-world needs. It’s so deep in the code step though that it would be pretty difficult to extricate. I can try if consensus is there to get rid of it.
best,
Walker
1 Like
Hi Walker and Keith.
Thanks for looking into this.
Just a quick recap. When I started to do the first linearisation, the test target for some reason printed (with the master curve), very dark.
My exposure time was to long but even after adjustment the test target was really dark.
I tried to linearise but the the program overcorrected to a very light print, and in the next step a very dark print and so on and on.
Walker, you thought that the reason for this was my light source and you sent me a set of curves made for a doped mercury lamp, to use as a starting point for my own linearisation.
( I use a light source with UV-tubes and a vacuum frame, bought from the Palladio company ).
So I printed a negative with the curve mentioned above and in the parts of the negative supposed to be just clear film there is density.
This is not a curve generated by me, I don’t know if you call it a master curve but it is one that you sent me.
When I print a test target from this negative and make a linearisation, I get a nicely corrected curve and the following test target looks good except that I don’t get maximum blacks.
I don’t mean max black as in the areas not covered by film, but max black where the paper has been covered just by the Pictorico film.
Of course I get the same result when printing the first test target, but the problem doesn’t change for better or worse after my first linearisation.
Would it be possible for you to change the curve so it doesn’t lay down any density where the negative should be clear ?
I should also add that when I make a negative with one of the master curves I get none of this problem, the darkest parts of the image are completely clear.
For information, I print with the Malde-Ware process and also with the traditional palladium-ferric oxalate process.
I enclose a screen shot from the measurement of a test target so you can see that there are no reversals or false values.
This may sound like a small problem but the change in dMax is clearly visible to the eye, and in my mind a Platinum-Palladium print with higher dMax always looks better than one with lower dMax.
Best Regards,
Johan
Things just get curiouser and curiouser (as Alice might say). Now it looks like my first interpretation was pretty close.
Let me now offer an explanation for the tone in the deepest shadow step, and hopefully a solution. Since I don’t know whether Johan is using PPE2 or the original PiezoDN software, I will show the cause of the unwanted tone using both PPE2 and CurveView:
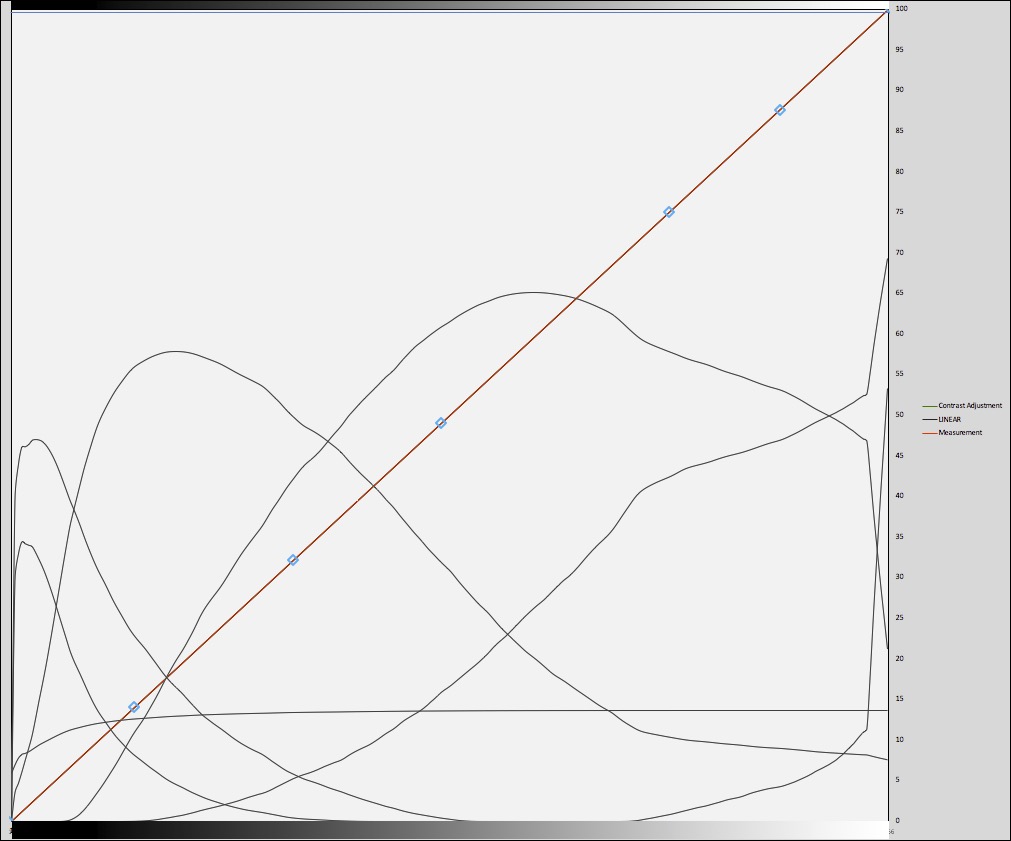
Fig. 1: PPE2 showing offending ink deposition circled in red
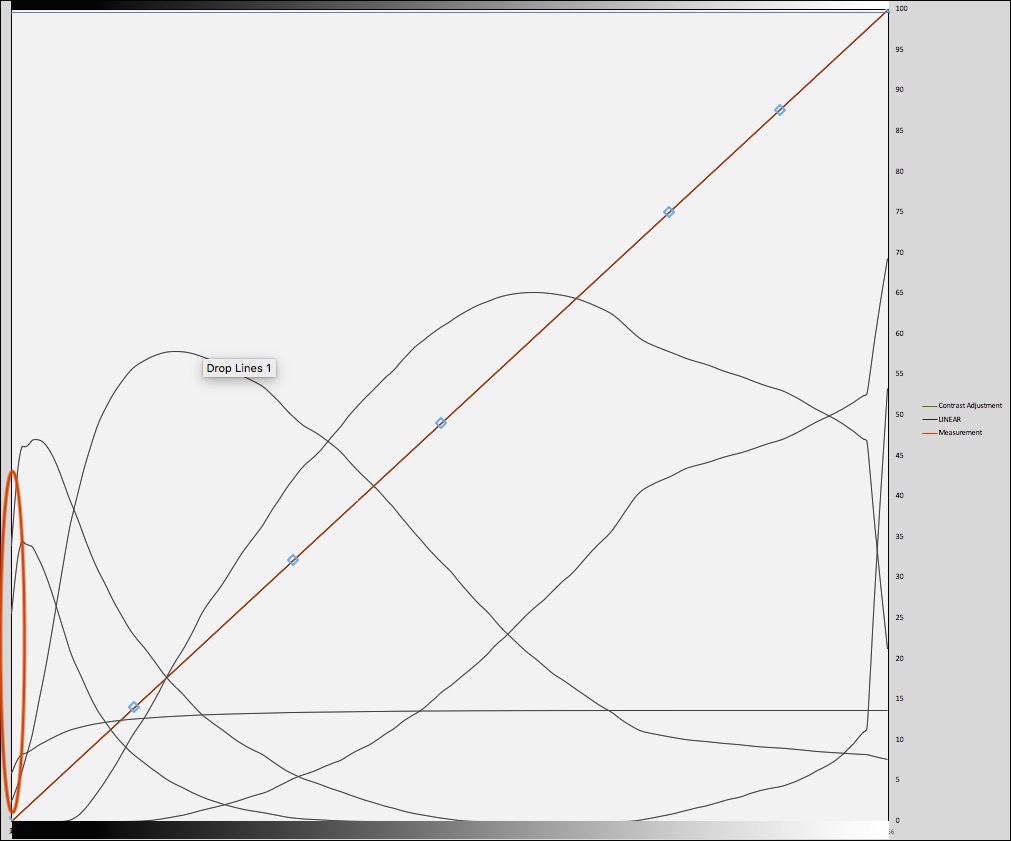
Fig2: CurveView showing offending ink deposition circled in red
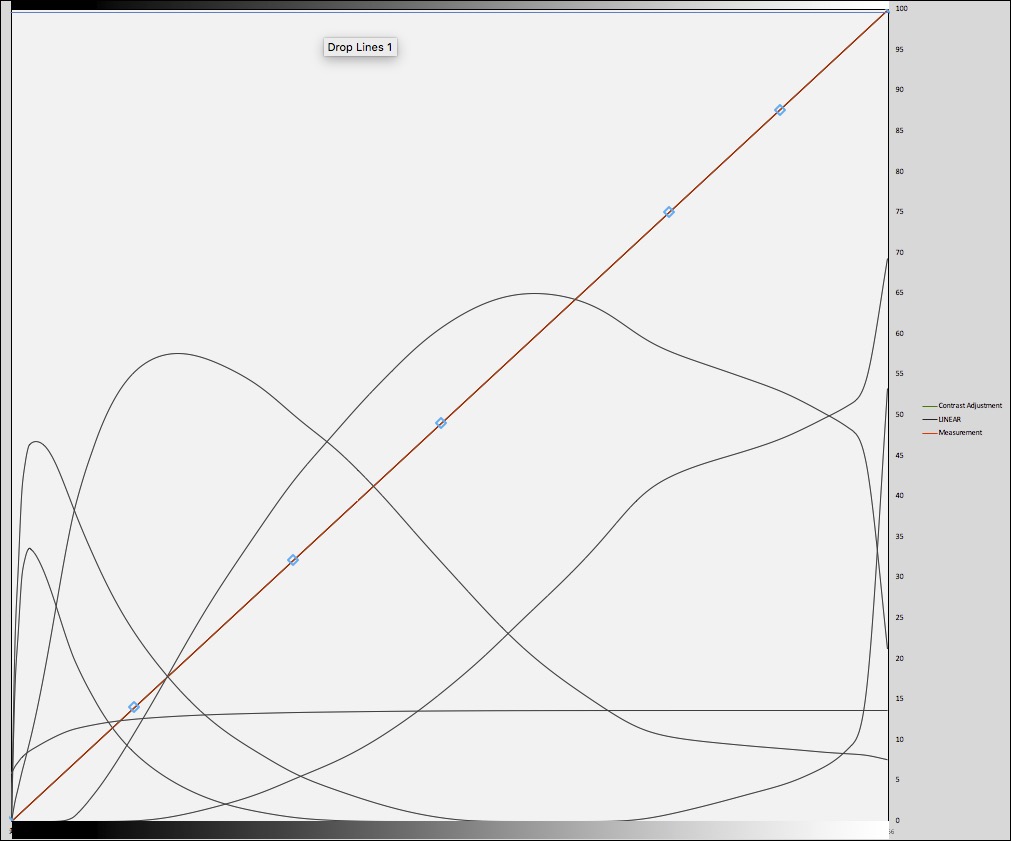
Fig 3: PPE2 showing ink level at step 256 of M, LM, and LK channels changed to zero
Fig 4: CurveView showing ink level at step 256 of M, LM, and LK channels changed to zero
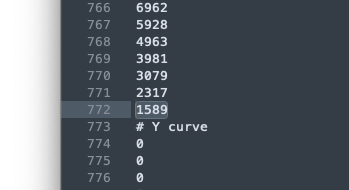
You can also observe this by opening the quad in your text editor and scrolling down to the final value in each channel as Walker indicated and illustrated above.
My solution to the problem is to open the quad file in Sublime Text; change the final value of the M, LM, and LK channels to zero; copy and paste that into PPE2 and apply some channel smoothing; copy and paste the resulting new curve into Sublime Text, and save as a new quad.
Here is a graph of the result:
And here is the modified quad: 3880-PiezoDN-CEP-HPR-OX-170606-b.quad.zip (3.9 KB)
Hope this works!
Keith
Hi Keith.
Thank you so much for helping me with my problem. I’m really grateful.
I just printed a negative of the test chart with your curve applied and it looks perfect.
No density left in the clear parts.
I will print it on monday and let you know how it goes.
Fantastic !
Best Regards,
Johan