I’d like to make a PiezoDN negative that I could use as a Stouffer step wedge. For the target image, I would use the 21-step-Spyder.tif. The Stouffer step wedge has a maximum density of 3.05, so I would need a QTR curve that lays down ink starting at a density of 3.05 and dropping linearly to 0. Does PiezoDN have a curve I could use for this? Or one I could somehow create from an existing master, not using actual densitometer measurements, but by inputting fake L* readings?
Is this possible, or is this a completely nonsensical idea? I’m using PiezoDN-Windows.
With PPEv2 software and a film densitometer you can calibrate to an existing set of optical/uv densities.
This would be a film to film calibration (not print in the darkroom).
- Target densities go into the “Target Measurements” sheet.
- Then print out the film target and measure those densities and put in the “Measurements” sheet.
- Put the starting curve in.
- Smooth your measurements and correct for falses.
- Your new curve will print the same density ramp as the Stouffer (or target film).
best,
Walker
Hi Walker,
I had hoped that measurements of any kind could be avoided because a Stouffer step wedge is calibrated: its optical densities are known. Cell 1 has density 3.05, cell 2 has density 2.90 and so on by increments of 0.15. So let me rephrase the question: Is it possible, using either QTR creation tools or PiezoDN tools (but no measurement tools), to create a QTR curve that prints a desired ink density ramp?
Only PPEv2 allows this type of density calibration.
Just type the densities into “Target Measurements”:
3.05
2.90
etc
Then you still heave to actually measure the density output of your film to calibrate.
The alternative is to print the stouffer in the darkroom, measure the paper, put these measurements in the “target measurements” section and then print the dig-neg target, measure the paper, and put these in the measurements section. This would do a similar thing but may not be as accurate. It would avoid using the Densitometer though.
-Walker
Since I had been wondering about this too, and had been thinking that the Target-Measurements sheet would be a likely candidate, I decided to give it a go yesterday - before you posted the above instructions. However there seems to be something missing, namely a starting curve.
In the above instructions step 1 is to put the target measurements into the Target-Measurements sheet. In step 2 you say to print the target and enter the resulting measurements into the Measurements sheet, but using what curve? Does it even matter?
I used the one I had just (finally!) made for the Dye inks linearized for Pd-KO on Platine Light. This morning I measured the negative densities (21-step pseudo Stouffer) and entered them in the Measurements sheet. I should note here that they must be entered dark-to-light even though on the Stouffer they go light-to-dark, otherwise you get a whole column of falses and no measured curve plot. (It doesn’t seem to matter which order the Target-Measurements are entered. I got the same New Curve either way.)
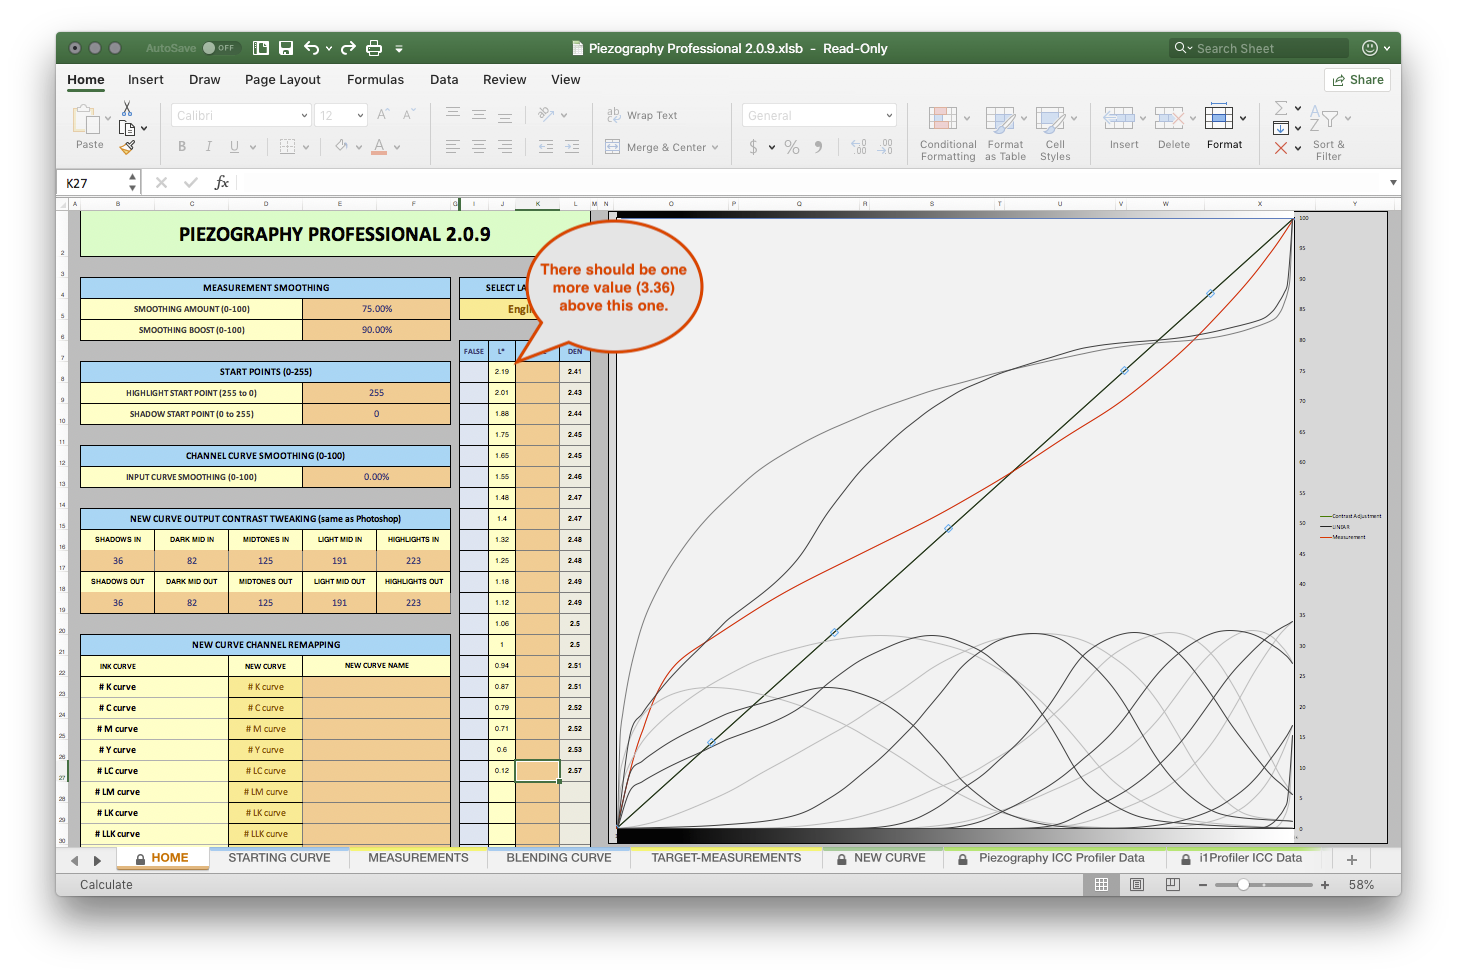
Also of possible significance, even though I entered 21 steps on the Measurements sheet, only 20 appear on the Home sheet - step 1 is missing! I’m pretty sure this has an adverse effect on the resulting New Curve and is why the result of printing with that curve is not what I expected.
I think you asked that we not attach PPE2 files here (I’ll send it to you off-forum if you want it) but here is a screenshot:
type the numbers into a note-pad and just paste them directly into the falser corrector column on this HOME sheet. That will work for time being
-Walker
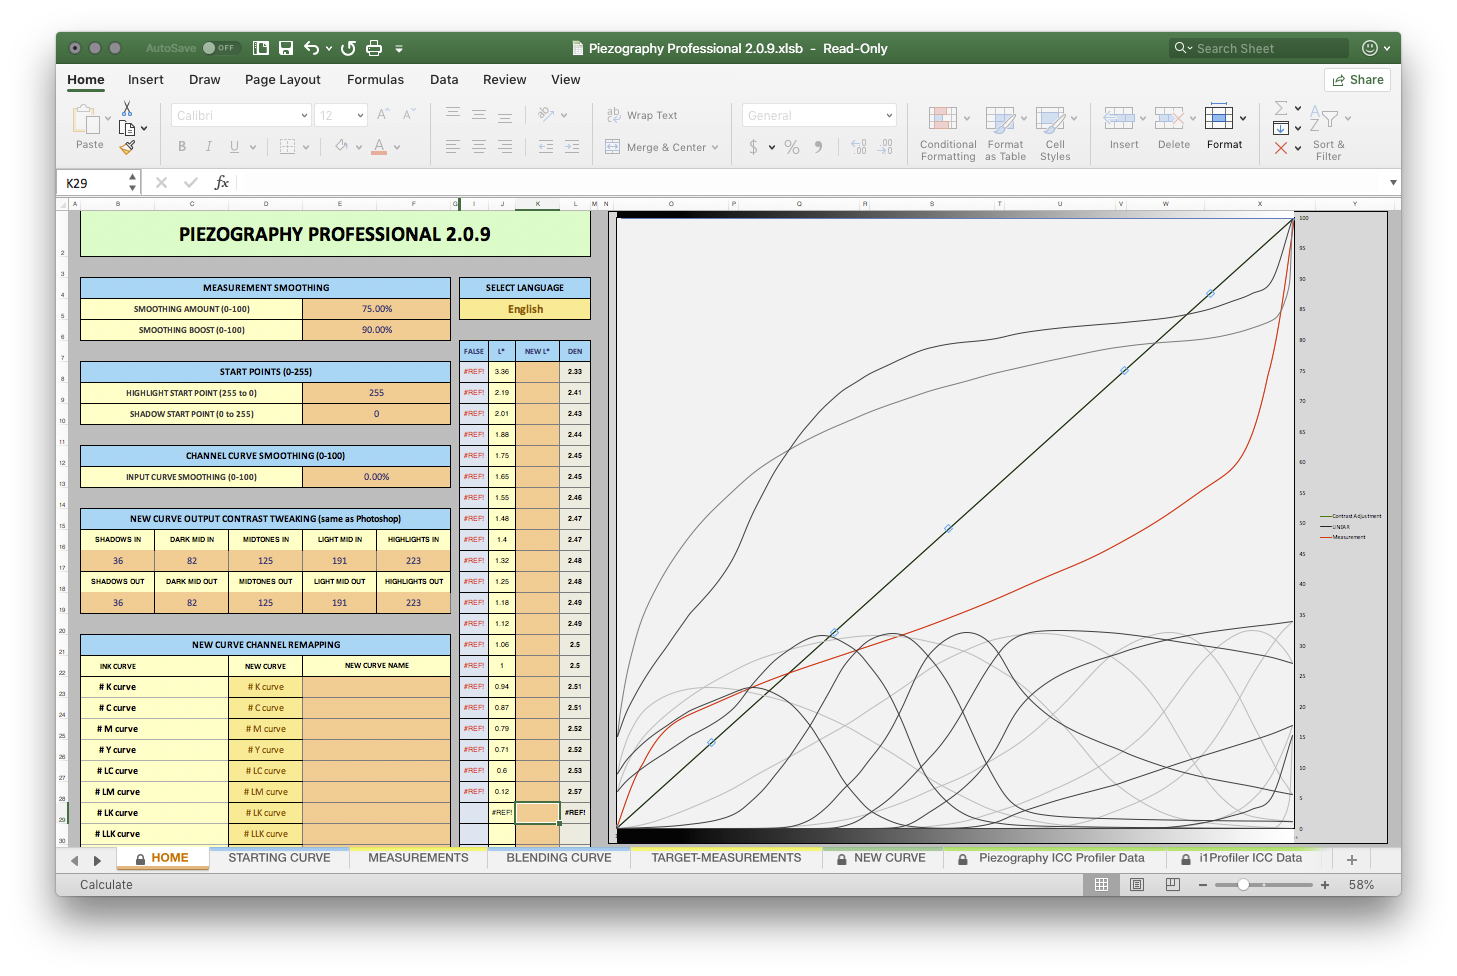
I already tried that and got this as a result which actually looks more like I thought it should, but there is no change to the New Curve. (By which I mean the New Curve is unchanged from the Starting Curve.)
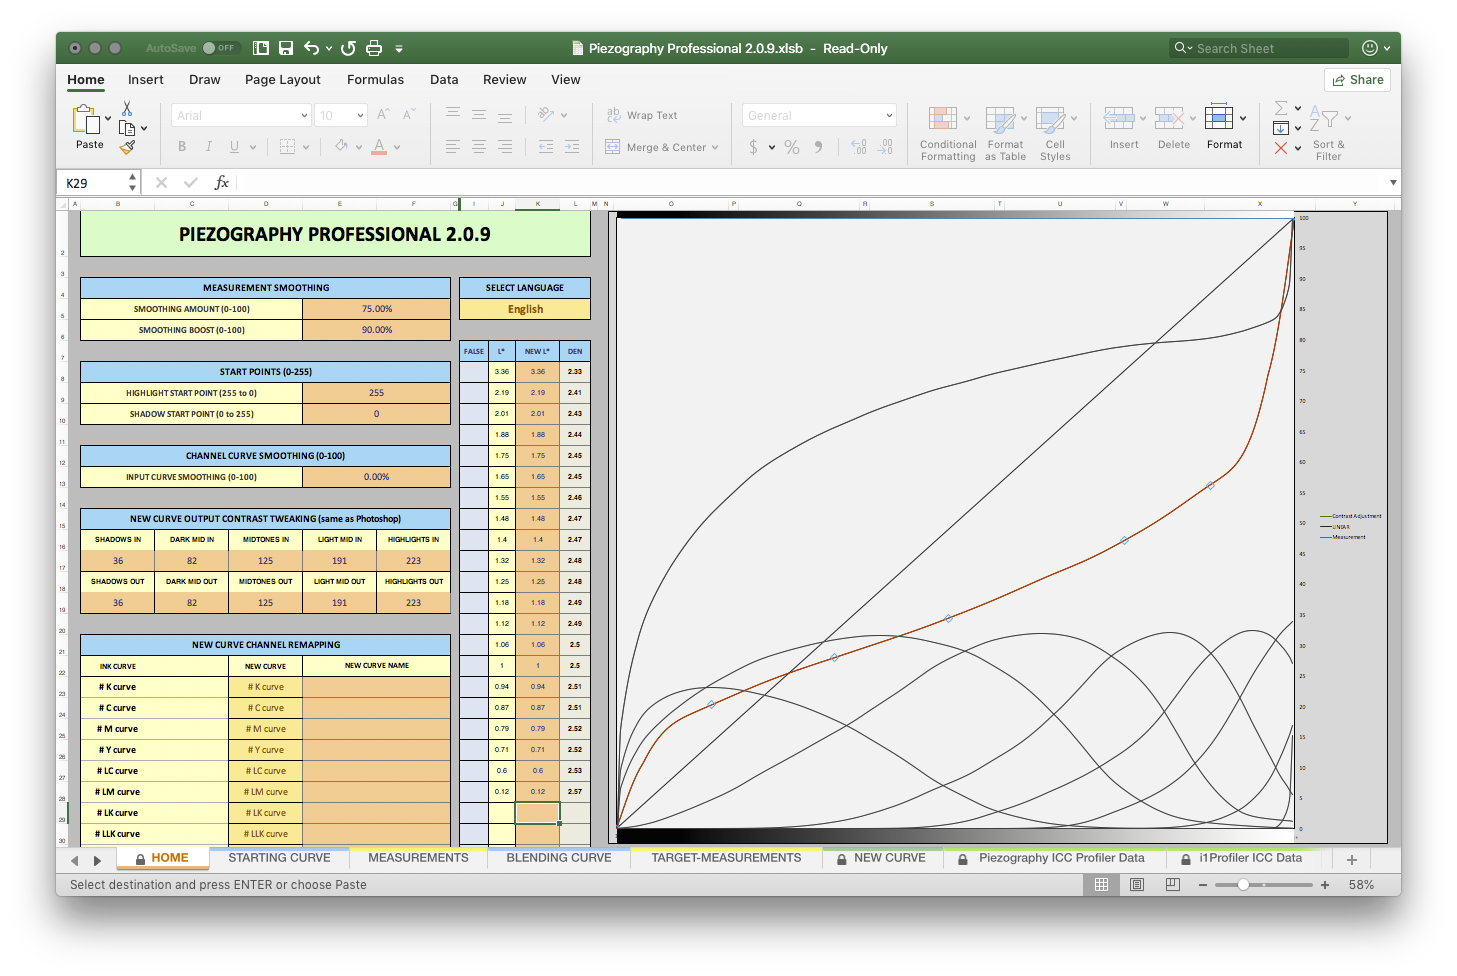
If I add an empty cell above the top value on the Measurements sheet (pull the whole series down 1 row) I get this, which looks like it might be something useful. What do you think?
Of course I failed to notice before printing with it that the above new curve had added a touch of tone to the left edge which should be zero or clear film. I couldn’t figure out how to avoid it though, so I manually went thru the quad and zeroed out the 3 or 4 channels that had a value at that spot. Then just for good measure I put in back into the PPE2 starting curve sheet and ran an extra smoothing cycle on it. A quick read of step 20 (next to Dmax) shows a 2.88 density value. I’ll read the whole thing after it has more dry time, but this looks promising.
Speaking of dry time, I started a test yesterday at about 5pm with a fresh target negative that I have read about 10 minutes after printing and at intervals of 1, 2, 3, 4, 6, 15, and soon 24 hours. Much to my surprise, other than between the first and second reads which had a small difference throughout, there has been no change other than a few points of 0.01 fluctuation back and forth. I intend to continue the series daily for the rest of this week then weekly for the rest of the month. I would love to know if anyone else has done something like this and how your results compare to mine.
1 Like
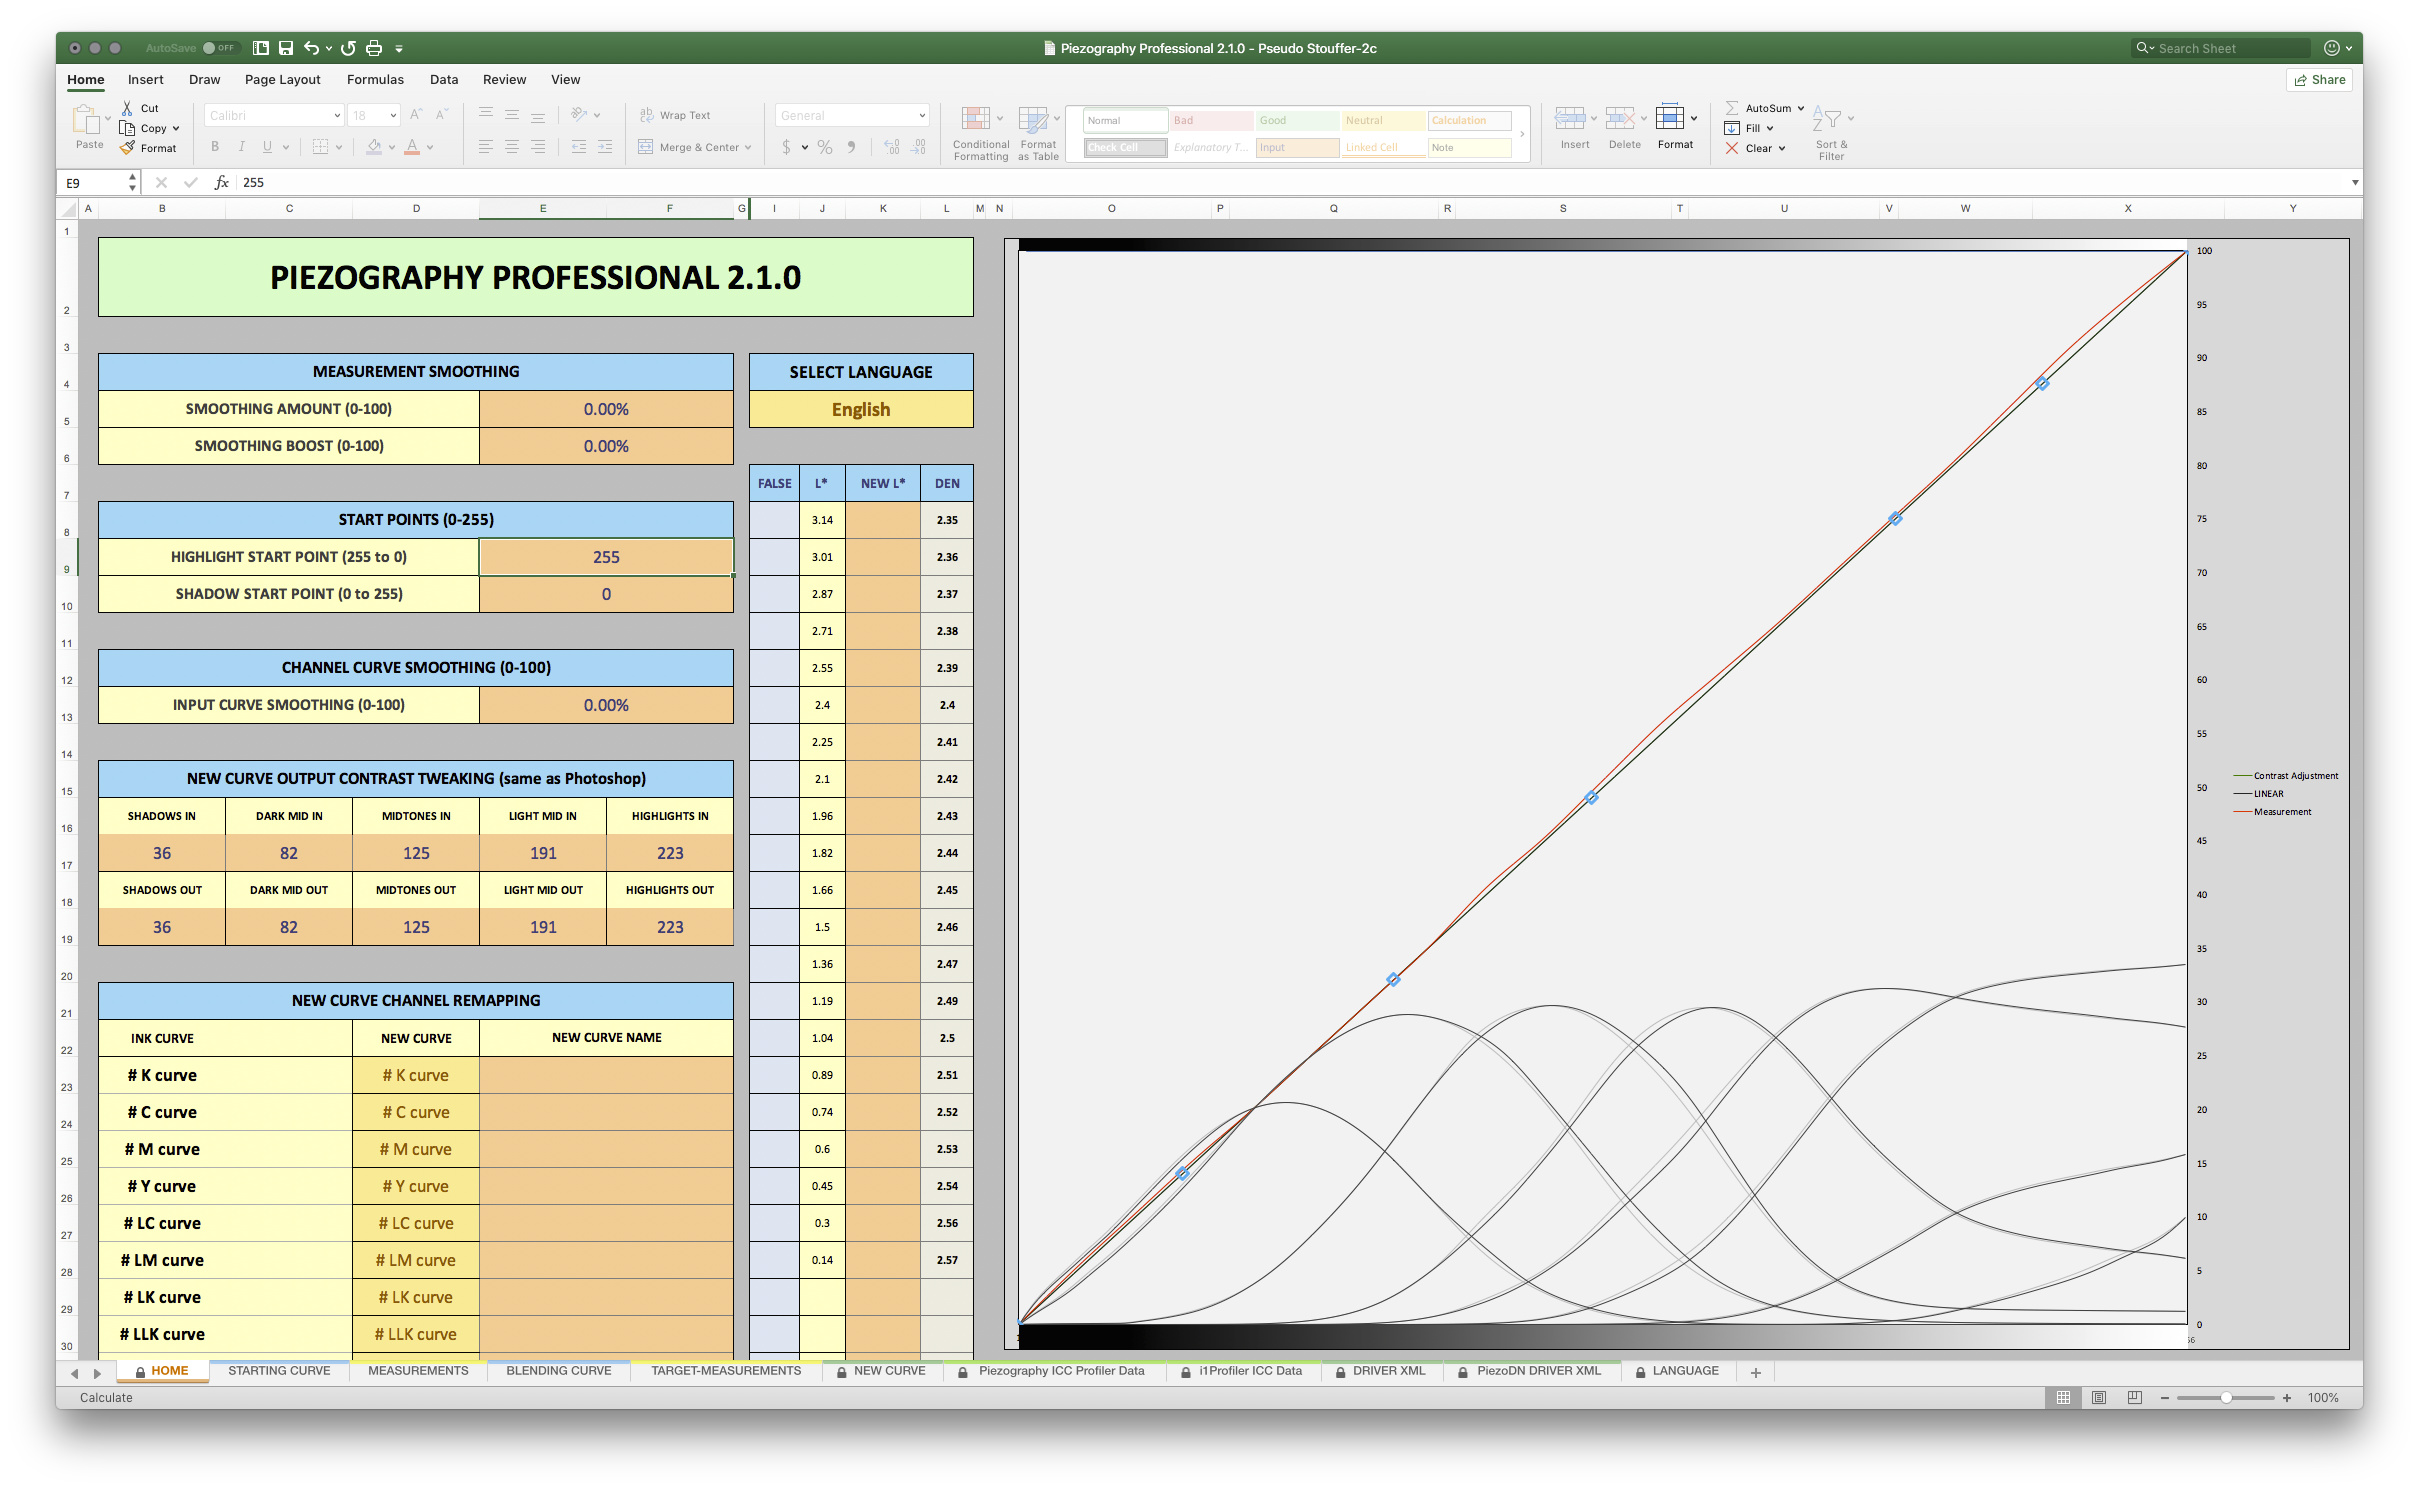
I’m happy (and somewhat surprised) to be able to report success at creating a digital “Pseudo Stouffer” 21-step negative. There were some glitches in the software, and I had to do a few unorthodox (or at least undocumented) procedures to get past them, but in the end I am able to make a 21-step negative that is closer to ideal than the tolerances in Stouffer’s own specifications.
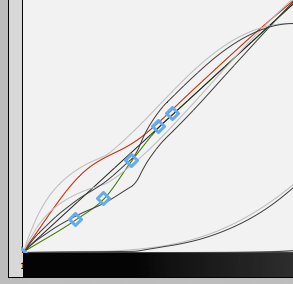
Here is a graph from PPEv2.1.0 of my final result:
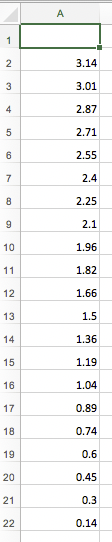
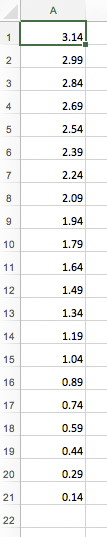
And the Measurements and Target-Measurements:
One of the first things I learned was that the target measurements have to be adjusted for the film base density - in this case 0.14 - rather than use the Stouffer film base density of 0.05.
The second strange thing was that the Measurements data had to be shifted down one row to avoid the top value being cut off on the Home sheet. Typing the corrections into the New L* column did not work; shifting them down in the Measurements sheet did work so I went with it.
A third thing, one that I might have anticipated and done first, was that leaving a high Dmax as we do for the black mask (and step 1) of a regular negative caused problems. I believe this is due to the small number of input values. I wasted a few iterations trying to avoid it, but after reducing the start point down to where it gave me the correct step 1 value (3.14) the rest mostly fell into place.
Probably also related to the small number of input values, the shadow end (thin end of the negative) was not being corrected by normal means. It was obvious what needed to be done - pull that section down a bit - so I used the New Curve…Tweaking to do it manually.
This still left some awkward humps in the individual channels involved. Putting the New Curve into the Starting Curve position (in a fresh instance of the spreadsheet) and applying channel curve smoothing affected all the channels which I did not want. So I wondered what would happen if I just pasted in one channel at a time. This worked beautifully for the 2 channels in question, and I simply pasted the smoothed channel data back into it’s proper place in the quad. The result is seen in the first screenshot above.
I did all of this with the beta PiezoDN Dye inks that a few of us are currently testing, so the actual quad is probably not useful to anyone but me (though I’ll be happy to share it), but I think we can consider this to be validation of the concept.
2 Likes
Genius writeup! I’m adding a few transmissive density features in future 2.x versions of this tool. 21step bug fix coming next though.
cheers,
Walker
ps:  This is (somewhat) how I calibrate masters from one printer to another sometimes if I don’t want to go into the darkroom.
2 Likes