I’m searching an equation for the calculation of the density based on L* (a and b) measurements.
Thank You.
I’m searching an equation for the calculation of the density based on L* (a and b) measurements.
Thank You.
ΔE = √((ΔL)² + (Δa)² + (Δb*)²)
Jon, thank you. Sorry my knowledge or understanding isn’t large enough? What do you mean with the ‘delta’? Is a ‘reference’ measurement of the paper required that needs to be used in the equation? Cause now I have a result that doesn’t seams correct. Sorry for the question to clarify.
TY - P.
Ok, based on your spreadsheet, I think you’re trying to figure out how to linearize or calibrate your output but only have access to a spectro but you want to devise some model instead based on densitometry.
Those kinds of calculations are pretty complex and the really good ones are usually kept secret by the companies that developed them. They use these algorithms to make their printing software work really well.
Instead of trying to reinvent the wheel, you might want to consider using one of the commercially available systems (like ours) that allow you to do this with a spectro. These tools are designed to give you accurate and reliable data, and they come with these calculations embedded within them that do all this for you.
It would probably save you a lot of time and headaches in the long run.
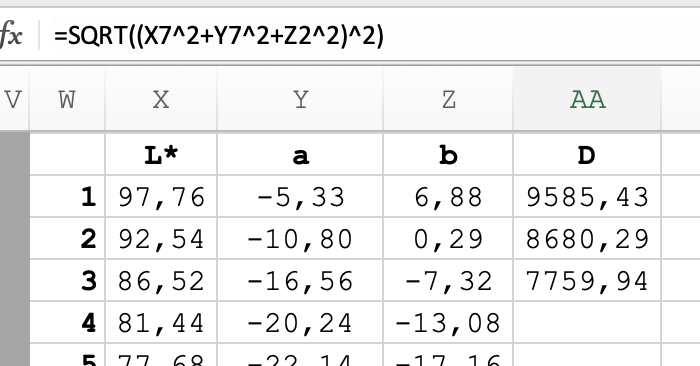
Dear Jon, I’ve already the PP version 2.2.2 and also for DN the tools. Since a few years and very happy with it. I’m using the SpyderPRINT for the measurements giving the Lab values. In the PP an optical density is given/calculated in column ‘DEN’. I assume on the L. Since I can’t copy the column I was wondering how I can calculate this density.
TY - P.
yes, its not straightforward. Best to let the software do it for you by copying your Lab data into it.
Jon - OK. Clear. What can I do if I would like to copy the ‘DEN’ column values?
I suppose you can jot them down. You’re only see two decimal places so not difficult.
Is there some reason why you cannot just use our software as is for its intended purpose?
What are you trying to do that it does not?
Jotting down 129 DEN’s values is time consuming and errors are not excluded.
I use already the tools for linearisation and building new .quad-curves.
In a separate .xlsx and .docx I’m make a sort of overview, findings, … as mart of the learning process and as well for information that I’ve ad hand for in the future. I had the idea to add the optical density values in this .xlsx. With a copy/paste (if possible/available) it makes life easier.
(I sent you an example of my .xlsx by e-mail.)
Regards,
P.
During Covid-19 lockdown I used Dr, Ware’s Simple Cyanotype frequently at DR 2.70 which is a bit difficult with the highlights not clouding but used Piezography Professional Editions Toolkit to linearize it quite successfully in just two iterations using the beginning Cyanotype.quad

I can’t know all that you are trying to accomplish with your spreadsheet you sent - but I wonder if you have not had success with using our tools and therefore trying to attain something you can’t with the toolset…
We usually direct that standard exposure time is attained first by simple exposure step test through clear pictorico OHP to find first optical dMax. Then use base cyanotype.quad to begin calibration with target which we prefer is 21x6 for hand applied sensitizers. Measure create new curve to print same target. Measure create 2nd curve and based on how linear the results were on the 2nd iteration make the decision to use as final or do one more validation test with new curve/target to create final curve.
Cyanotype is also affected by humidity so this should all be done in controlled environment. Takes just a few hours from beginning to end - drying is the slowest part…
Are you doing something different from this? For example your base exposure is it dependent on factors other than exposure through film - perhaps some sort of example following another type of workflow and then you try bring PiezoDN in on the equation? Have you tried pure PiezoDN workflow?
I noticed in the xls you sent that you have created your own starting curve which is neither a Piezography Pro curve nor a legacy K6 curve… but your own using standard K6 shades.
And you seem to be using instructions from toolsets that are not PiezoDN and creating data based on them.
You seem to be struggling perhaps to reach the expectations that you have for your finished work. Therefore, I wonder if you have ever used PiezoDN to create a calibration in the way we instruct or you are devising a hybrid of your own which are fighting one another in that endeavor?
Have you used pure PiezoDN workflow beginning with base exposure, then printing targets and measuring to create curves in two or more iterations?
Jon, later on I will provide more information about the different steps that I follow. As a first summary.
STEP 1
STEP 2
STEP 3
(With the new curve I print a new 129 Patches TARGET to finetune more.)
For the LIMITER and the TARGET I use Pictorico Ultra Premium OHP Transparency Film.
Inkset is P2 // SC P-600.
I’ll provide the P.P.E. file that I’ve used for this Method and .quad.
The .xlsx that I’ve created is only for ‘visualisation’ of the different informations (as part of better understanding an learning and to remember later what I’ve done).
I’ve tried to use the the PiezoDN tools and from the moment that I needed to created the now .quad with the two files - nothing happend. Therefore I switched to P.P.E. cause I understood from another post that this also possible.
I’m struggling because I learned (the hard way) that humidity has a major effect on the results. With first attempts room humidity was about 65 à 70%. No I’ve the Humidity Box in use again (with NaCL). A box made on the instructions as on Mike Ware’s video (for Pt/Pd). Also I’m not sure if I need to limit yes or no. I try to find also a method to figure out (by measurements with spectra) if the applied coating is OK. I’ve noticed some ‘spikes’ in the measurements and wondering if this is ‘acceptable’ of due to a not even applied coating or others. I also switched from brush to rod and use Citric Acid and Tween as additives.
Is it correct that by following above steps that I follow in a correct way the recommendations and ‘procedure’ from Piezography.
Later I’ll provide some more information with some screenshots, pictures, … to explain my workflow.
In meantime thank you for the support and greetings form Belgium.
P.
I received your PPET v2 xls and your results are extremely light and the measurements are poor. You should be using 21x16 for hand coated media.
But your explanation if I am understanding correctly, and I may not - is that you are first using a calibration method to limit by an author not associated in any way or experienced in any way with PiezoDN or PPET.
We normally do not recommend limiting as that has already been done for you and theoretically Cyan can NOT get too dark. So a limiter target is totally unnecessary. But I do not see any limiting in the Starting Curve. So you have not limited the Cyanotype.quad which is what limiting would normally do in PPET
If instead you have done something to limit the printed target file you are printing and measuring for PPET then this is throwing off everything. If instead you mean limiting a Curve in Photoshop that is adjusting the target then you are throwing everything off.
Obviously these two systems of calibration are incompatible with one another… So please explain what you have limited prior to actually beginning PiezoDN workflow before I can comment on anything past Step 1 and Step. 2 which are most definitely not PiezoDN steps…
Jon,
Thank you. I try to clarify the best I canN.
“I received your PPET v2 xls and your results are extremely light and the measurements are poor. You should be using 21x16 for hand coated media.”
→ ‘extremely light’ ; what do you mean?
→ ‘poor measurements’ ; I measure with the SpyderPRINT (by hand) and have followed the instructions from Keith’s article on his blog. Could explain what I can do better or in an other way?
→ So the 129 Target is not OK and I need to calibrate/linearise with the 21x16 TARGET? I’m confused.
“But your explanation if I am understanding correctly, and I may not - is that you are first using a calibration method to limit by an author not associated in any way or experienced in any way with PiezoDN or PPET.”
→ It could be that the different steps (1-3) that I follow are not correct. If I remember correct then I followed the steps based on the information I found a long ago on the Piezography website? I’m used to work with PPE for the b/w digital prints (positives) - PiezoDN I’m a beginner. I’ll take the time to reread the following link:
https://shop.inkjetmall.com/piezodn-and-the-digital-negative
I thought that the PiezoDN LIMITER Target is a necessary step (priced with the BET by STEP 1.)
“We normally do not recommend limiting as that has already been done for you and theoretically Cyan can NOT get too dark. So a limiter target is totally unnecessary. But I do not see any limiting in the Starting Curve. So you have not limited the Cyanotype.quad which is what limiting would normally do in PPET”
→ It’s correct I’ve used as staring the curve the P2-PiezoDN-Cyanotype.quad as installed with the PiezoDN Package. For me it’s not clear based on the print if limiting is required. For example:
(Correct I’ve not flipped horizontally cause I’ve forgotten in on the moment of digital print.)
“If instead you have done something to limit the printed target file you are printing and measuring for PPET then this is throwing off everything. If instead you mean limiting a Curve in Photoshop that is adjusting the target then you are throwing everything off.”
→ I don’t understand because I’ve used the date from the original P2-PiezoDN-Cyanotype.quad as ‘starting curve’ (by copy paste from open filed in Sublime Text).
“Obviously these two systems of calibration are incompatible with one another… So please explain what you have limited prior to actually beginning PiezoDN workflow before I can comment on anything past Step 1 and Step. 2 which are most definitely not PiezoDN steps…”
→ I didn’t limited the starting curve. Used it as is unless I’ve overlooked something.
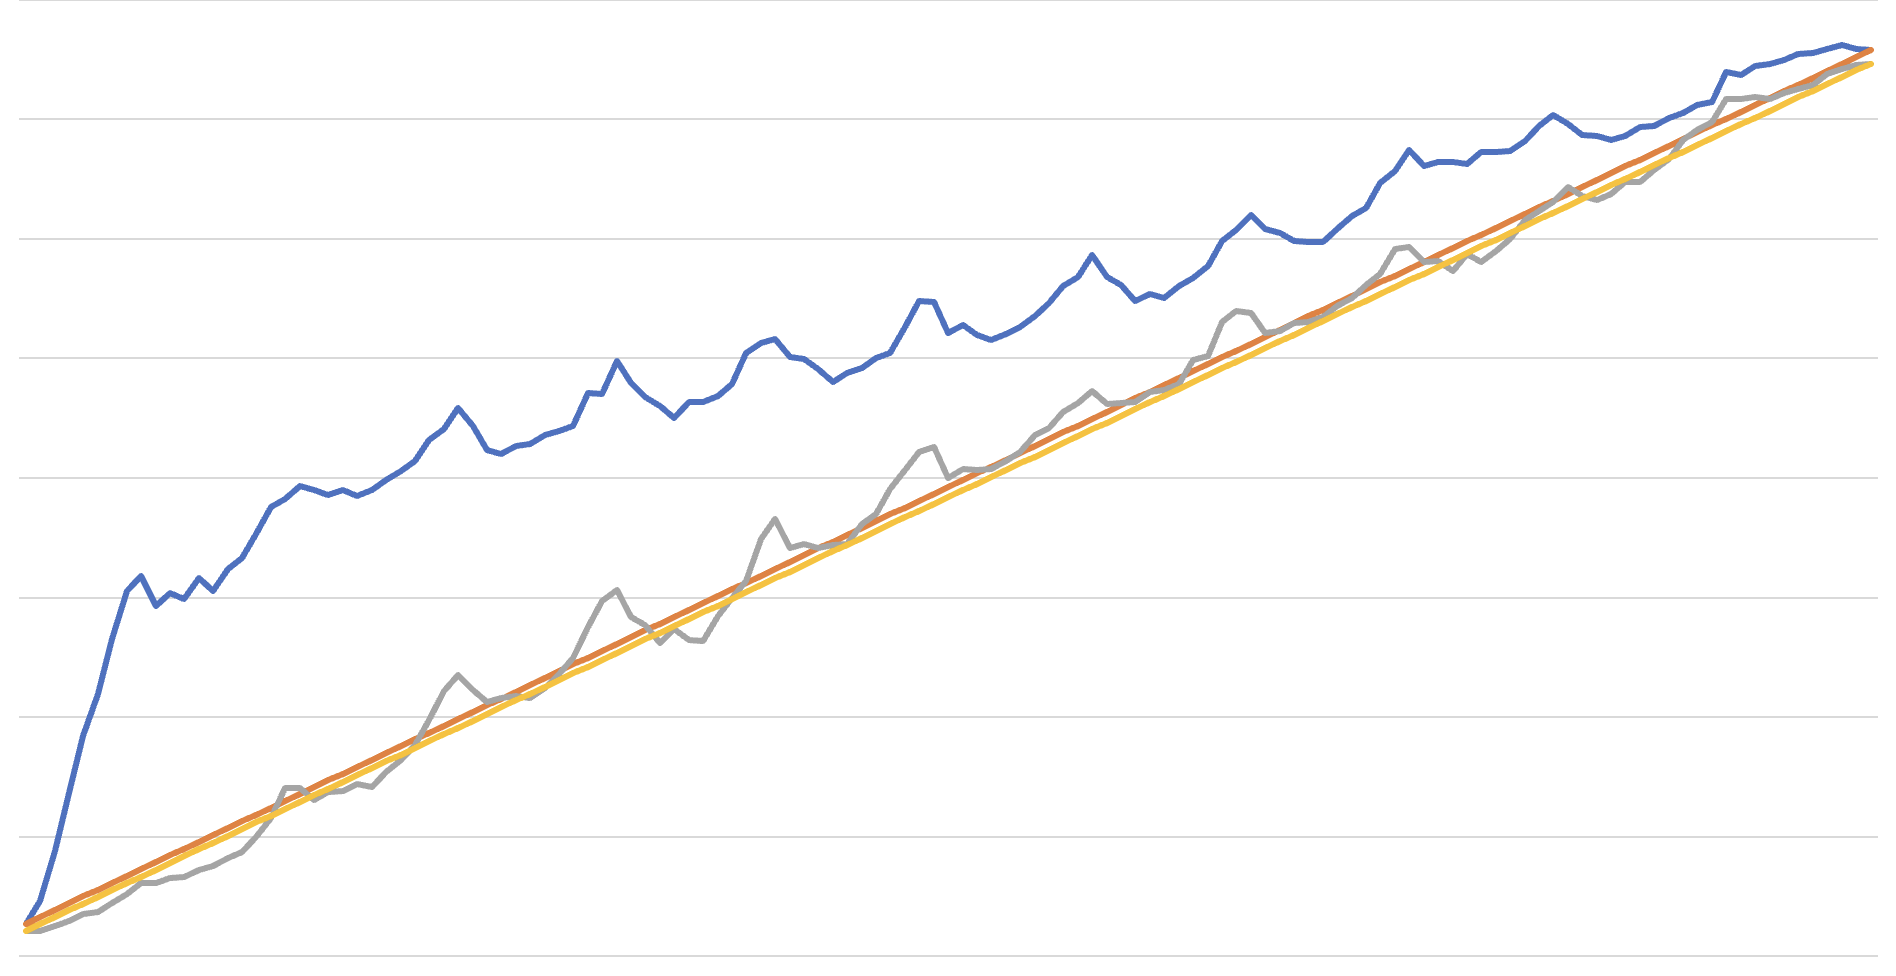
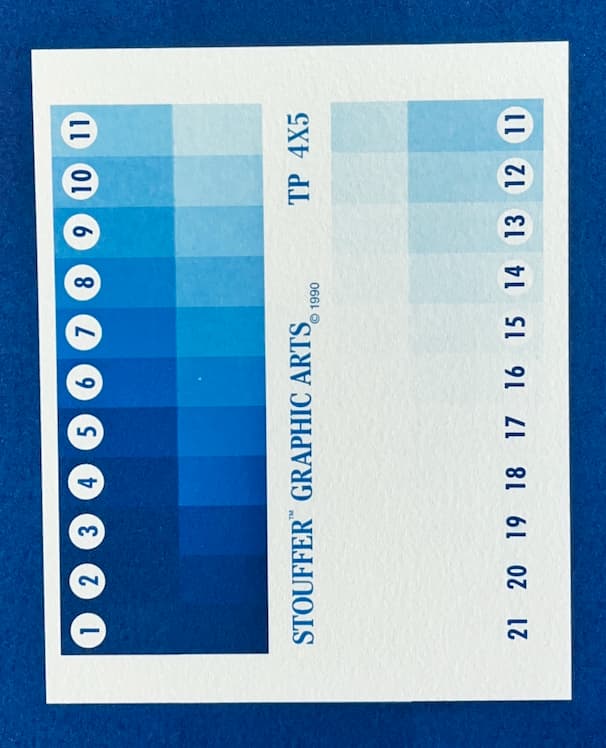
For the STEP 1 I used a Stouffer 21 4x5 Step Wedge and calculated the BET. I measured the Optical Density with a densitometer (Heiland). Continued with STEP 3 129 Target (no need to LIMIT) with following results.
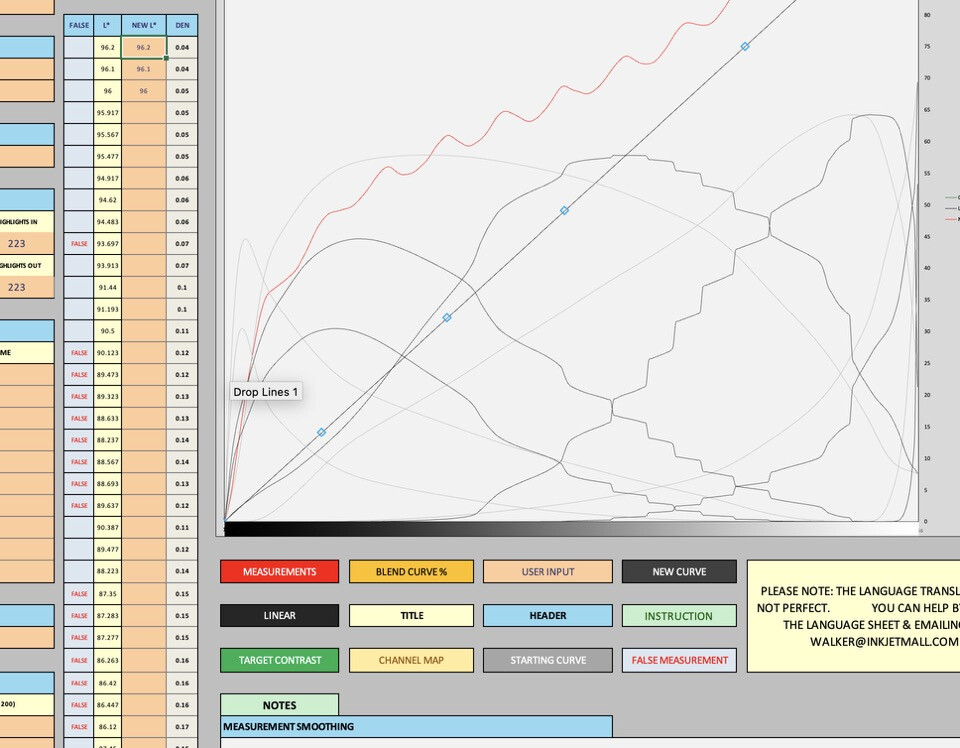
Blue line measurements with 129 TARGET and P2-PiezoDN-Cyanotype.quad
Grey line measurements with 129 TARGET and P2-PiezoDN-NC_Methode_24_02a_LIN-1.quad
What can I do different and better?
Thank you.
P.
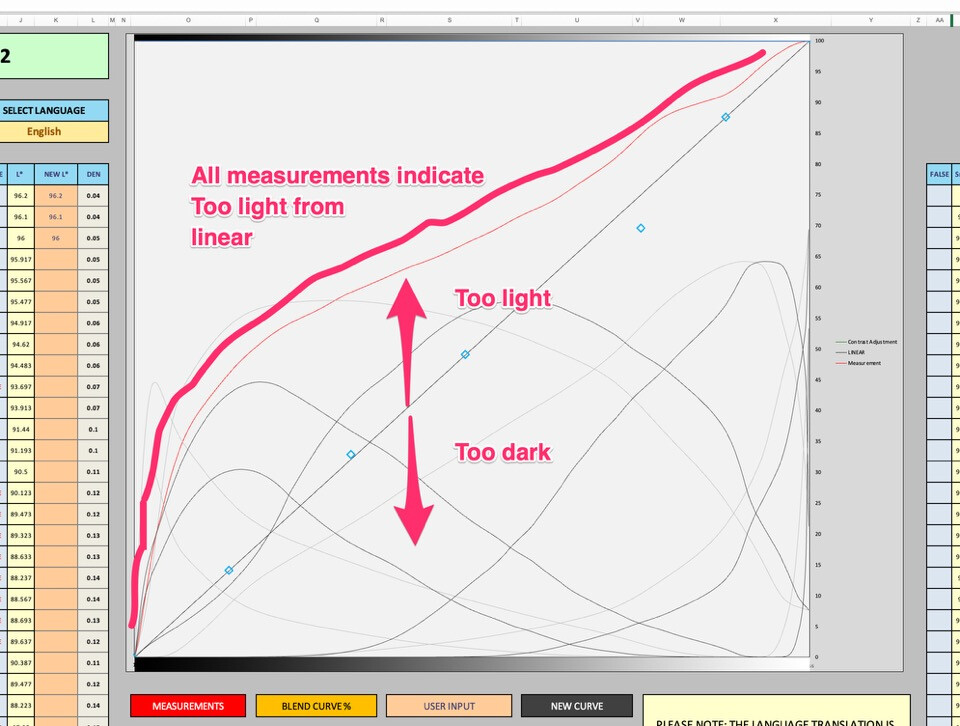
By extremely light I meant that the red line (which I drew a red line just above it to bring your attention to it) is indicating the lightness/darkness of the measured results is really very light overall
The poor measurements are choppy and mostly false:
Choppy and mostly false
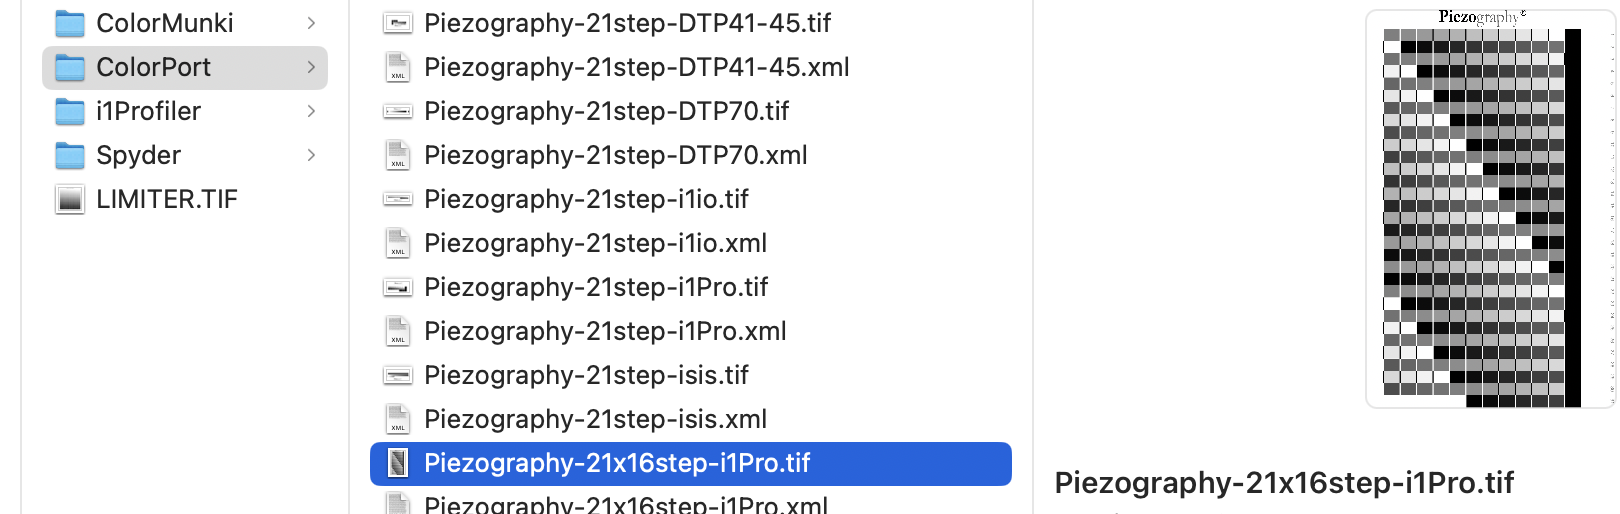
The 129 target is not recommended because you are using hand coating to apply the sensitizer to the paper and the application is not perfect as it is for coatings applied to inkjet paper by machines carefully calibrated to apply the exact amount of inkjet receptor coating as they do with all manufactured inkjet papers - which you can use a 129 or even a 512 target if you like. But with hand coating, the application from the hand is imperfect. The 21x16 allows for measuring each of the 21 steps 16 times on different locations on the media and is averaged together to make a superior linearization.
In regards to limiting we write: You have two choices when getting the right starting .quad. One choice is to use one of the highly specific .quads we’ve created for a given process.
Until you become an expert in calibration you should use one of the highly specific .quads we’ve created because you can’t possibly do correct limiting until you have mastered the process - and at the least created several successful linearizations. It is potentially necessary if we do not provide you a starting .quad which in this case we did.
In the example of the limiter target you printed it may be better to adjust the original curve with the NEW CURVE OUTPUT CONTRAST TWEAKING to counter the overall lightness.
You mentioned you did limiting but I did not see that in the Starting Curve or New Curve of the .xlsb you sent me. Then what have you limited? Maybe I do not understand because you mentioned that you limited….
According to your graphing, you are getting closer to being linear but your measurements may become smoother with the 21x16 target and will eliminate what are either false readings or measurements being affected by uneven amounts of sensitizer…
How we teach is:
that every alternative process has a standard exposure time that must first be determined by a simple exposure step test through the actual film being used (because OHP absorbs UV). Working with Photopolymer plates of different grades always needs limiting. Most sensitizer based processes on paper do not. Once the exposure is determined by establishing the first useful dMax (meaning there is no point to over exposing until it is as dark as possible because in doing so, fidelity will be lost at the expense of a few more 10ths or 100ths… so do it visually after dry down.
Then using 21x16 and base curve - go through the linearization process to create a new curve
Use new curve to repeat 21x16 linearization process and create 2nd new curve
Use 2nd new curve to validate via 21x16 and accept 2nd as final or create a 3rd as final.
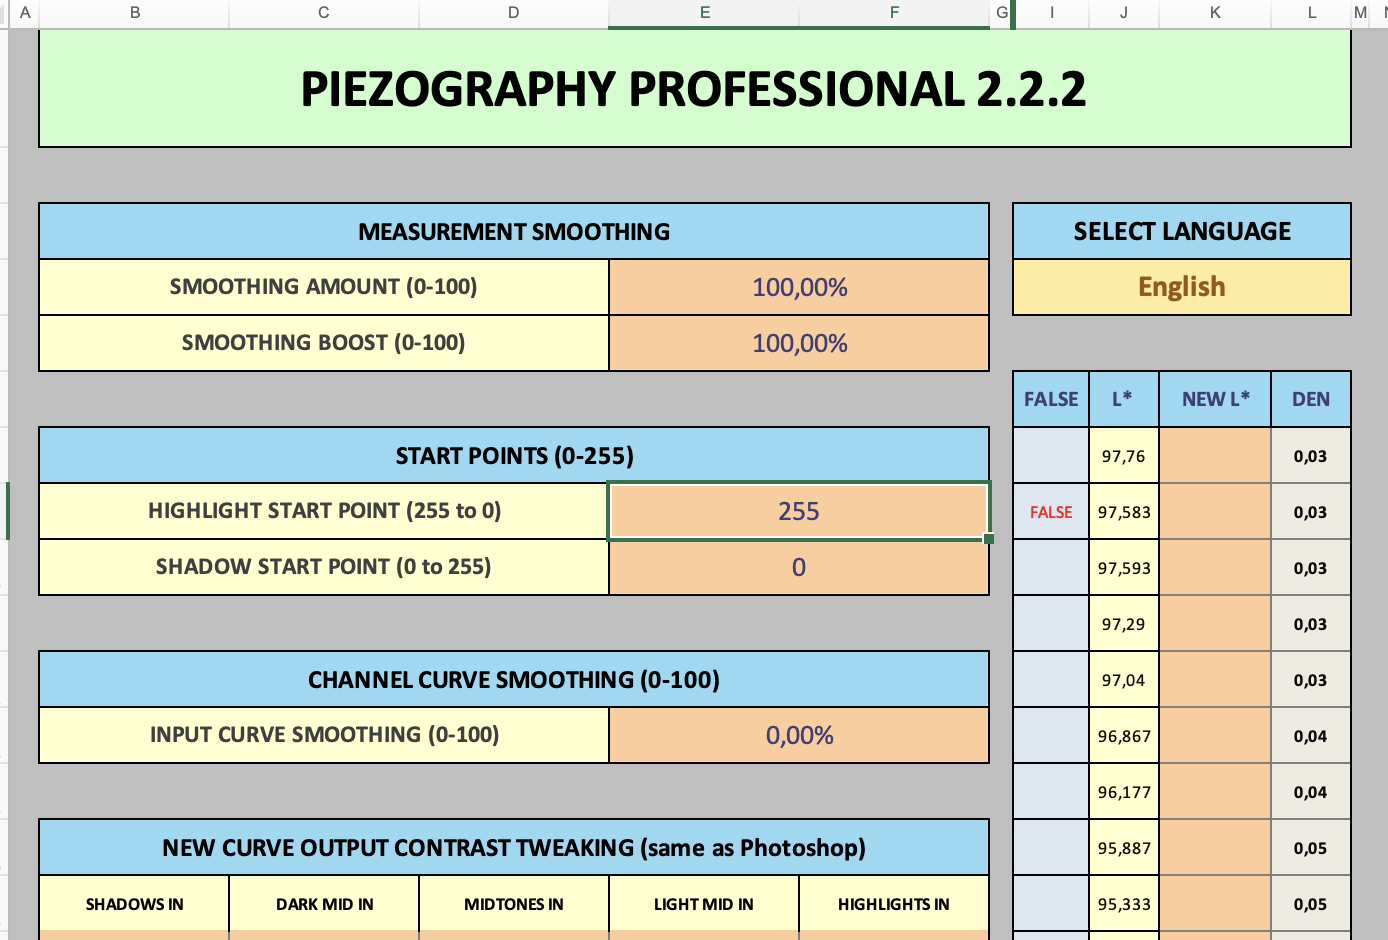
Normally we use 70% and 20% boost in measurement smoothing. You are needing 100% in both to deal with the measurements from your Spyder…. Hopefully with 21x16 you can return to our recommendations as it will produce better fidelity in the curve.
Hope this helps and allows you to get it right. Feel free to share anything else with me that you need.
Kindest regards,
Jon
Jon - thank you - learning a lot with the passion/knowledge that you share.
It’s clear that I need to restart. Which I’m prepared for because it is far too much fun to give up right now
STEP 1 : determining the starting exposure time (or base exposure time)
Can I use the 21 StepWedge form Stouffer (or the 31)? As an example what I did in the past:
I measure the optical density because sometimes it’s difficult (for me) to distinguish between the ‘darkness’ of different steps. I thought be measuring and calculating it would be ‘straightforward’?
The use of the StepWedge is convenient. This is why I prefer this method. I assume that based on the above example I can define the standard exposure time visually (as you suggested). How knowing that the StepWedge was exposed for 10 minutes can I determine the standard exposure time for the given proces?
STEP 2 : printing the TARGET for first linearisation process
By your explanation I’ve learned that there is a huge difference between hand coating and ‘print coating’. So the 21x16 is more the way to go for hand coated prints. In the ‘Piezography Images’ for SpyderPRINT I have the following available (thus no 21x16):
Can use this one instead for measuring with the SpyderPRINT?
I print the TARGET with the P2-PiezoDN-Cyanotype.quad let it dry overnight and make a cyanotype with the standard exposure time from STEP 1 and the same amount of sensitiser, development, clearing, …
The Humidity Box that I use has a RH of about 75% (depending of the temperature). Is that ‘acceptable’ or to high or which salt instead of NaCl you recommend for a lower RH?
After applying the coating (sensitiser with 1 drop per ml 40% Citric Acid and 1 drop per ml 5% Tween 20) I let the coating ‘dry’ until matt and than I put the print in the Humidity Box for at least one hour?
Sorry that I didn’t was clear enough - it’s correct that I didn’t limit the starting curve. I only dit a ‘limiting’ step in the meaning printing the target for evaluation if a limiting is required. Does no limiting have I done.
Thanks again!
P.
Pictorico OHP film absorbs much more UV than the Stouffer film material. So anything you do with Stouffer may be just to get you “near”. We recommend that you do your final exposure testing by step exposure through a strip of unprinted OHP. if you do this as a strip so you can compare each amount of exposure you will notice that the paper without the OHP film becomes darker much earlier… So we think it is a best practice to determine the optimum exposure both visually (when it appears to be dMax) using the OHP film.
Let’s say for an example that the Stouffer indicates an exposure of 10 minutes. You could then switch to cutting a strip of OHB and taping it to the sensitized media - and start your exposure at 8 minute, then add 20 seconds each time, covering up a small part of what was previously exposed. So perhaps you have 8 min, 8:20, 8:40, 9:00, 9:20, 9:40, 10:00, 10:20, 10:40, 11:00, 11:20, 11:40
Of course the 10 minute I picked out of the air as I do not know where your exposure is getting close.
When it is dried you will see that the OHP film makes a significant loss in UV
Choose the one that is the first to give a satisfactory dMax - not the one that is the darkest because you could further and further and further expose trying to measure such a tiny gain - and this is detrimental to smoothness overall. You only need a convincing dMax.
75% rH is a little high but should be ok - maybe trying for something closer to 65% but I can not remember the salt for that. I think that calcium nitrate tetrahydrate is about 55%. There probably is a chart on Mike Ware website for salts and hydration tanks.
If you are hand measuring you can always use the chart that is large enough for you to measure. I hope that you have a good result!
Jon
Jon, Rachel,
I’ve (finally) a periode where I can restart with the New Cynatype. Before I start, I would like your advice if the following STEP-by-STEP method is in line with the recommendations for BET and Linearisation.
Epson P-600 (Eurpe) with P2-inks
SpyderPRINT
New Cyanotype
· Bergger COT 320.
· Brush with 4 micro-liter (-5%) per cm2 Mike War’s New Cyanotpye Sensitizer.
· Add 40% Citric Acid (anhydrous) with a quantity of 50 micro-liter per 1 ml Sensitizer.
· Adding Tween® 20 with a quantity of 50 micro-literl per 1 ml Sensitizer.
· UV-box is with VerifiedUV LED’s Version 1 (self made box).
· Development with 1,5% Citric Acid during 5:00.
STEP 1 – Base Exposure Time
· Base Exposure Time with Step Wedge method sensitized area partially (1/2) covered with Pictorico Ultra Premium OHP.
· Process and overnight drying.
· Look voor the dMax in the OHP area (and this should be somewhere in the middle of the steps) to determine the Base Exposure Time.
STEP 2 – LIMITER (skipped)
STEP 3 – Linearisation with 21 x 16 Target and P.P.E. 2.2.2.
· Printing 21 x 16 Patches Target with the P2-PiezoDN-Cyanotype.quad and P-600 (Europe).
Q : I’m not sure if the available 21 x 16 Targets for the X-Rite will be measurable with the SpyderPRINT due to the smaller patches?
· The day after (to let dry the TARGET) exposing with BET form STEP 1, development, clearing, washing, … and overnight drying.
· Measuring L* a b with SpyderPRINT and use the average of the 21 x 16 patches for P.P.E. 2.2.2. mesurements.
· Starting curve and measured values in P.P.E. 2.2.2. for creation of new linearised .quad and installing for use with the P-600.
· Repeated for validation or finetuning.
Thank you.
P.
Hi Peter,
I think that you can not use SpyderPrint for 21x16 because of patch size…. It would be an enormous target for you to scale up to SpyderPrint size in order to read it.
Averaging is important for hand coating unless you have a perfect hand and are confident that the exact same amount of sensitizer is applied at any one place. You could instead use one of the supported targets and produce several sheets with each iteration.
Perhaps three sheets is a good test each time for how stable your process is because if the targets swing wildly from one to the other that might indicate that your process is not stable enough to linearize. Therefore, not a bad way of proceeding at all. More of a confirmation that your linearization is going to be quite good. But if the three sheets vary strongly - you then work on repeatability before linearizing.
Hope that makes sense!
Jon
Jon, thank you.
I’ll print/make 4 targets to average the measurements with the SpyderPRINT.
To be ‘sure’ is the above work method (the different STEPS) the way to linearise? I’m not 100% sure and also to avoid time and materials.
(When the ‘Limiter’ should be done as part of the work method?)
Regards,
P.