Hi, I tried a 21 step adjustment curve using the procedure in the manual to bring down the highlights a bit in the printed step tablet. I’m attaching the measurements (first tab - not the best curve I know) and the CGAT output (second tab) in the attached spreadsheet. This seems to have successfully generated a new quad curve which I used to print using the newly created curve in Print Tool.. Measuring the UV densities in the digital neg and the reflective densities on the resultant print, the adjustment seems to have worked in the wrong direction i.e. the highlights are now darker rather than lighter. Are there any clues to what is not working here. I’m using Piezo DN vs 1.5. I tried to upload the adjusted quad curve but without success. Thanks for your help. Julian
Just to make sure I’m on the same page, I notice that your attachment is using the 21-step Scanner Tool. Are you using this instead of the 129-step Smoother because you don’t have a spectro to read it? Or are you using it to try to make a manual adjustment? (On my first reading I thought you meant the latter, but now I’m not so sure!)
I have a couple thoughts on this. First, using a scanner to calibrate the process is nowhere near as accurate as using a spectrophotometer or densitometer (though there is no support yet for densitometer readings). I think that the intention is that the 21-step tool will eventually be densitometer compatible too. (Walker!) Second, in my experience with PiezoDN so far, the first round of the linearization process gets you fairly close to linear but not all the way. A second iteration gets it almost perfect; probably as close to perfect as it is possible to get with a hand-coated printing process. Making an ICC profile from the linearized .quad brings the whole range down a bit (darker) for reasons that Walker has explained to me but that I don’t quite understand. Personally I don’t like the effect of the ICC. If you need to manually adjust the curve for a particular look that you are after, try using the Piezography Curve Adjustment Tool which allows manual control of the curve similar to a Photoshop .acv curve.
One comment about terminology. To bring a tone or value down means to make it darker, not lighter. Think turn down the lights! Down does not necessarily mean a smaller number, nor does it necessarily mean lower on the graph. For example, with Density values that you might be familiar with a lower number means a lighter value, but with Luminosity (L* - the L part of LAB) it is the opposite - a lower number means a darker value. PiezoDN uses L* values.
I am a long-time (20+ years) densitometer user, and it was not easy for me to switch, but well worth the effort. I have also recently figured out how to convert both Density and Luminosity to percent in order to compare them, and they are definitely not the same. I was always needing to manually lighten a linearized curve based on Density, whereas Luminosity based linearization looks right to my eyes.
Please forgive me if this is stuff that you know already, but it may be useful to others, too.
Thanks Keith. My attempt at linearization of the quad was done using the 21 step scanner tool and a scanner to measure the L values as per the Alternative Calibration Workflow in the manual,. Once I get this short cut method sorted I will tale your advice and move on to spectrophotometer method. I too am still coming to grips with L values rather than density,
I suggest exactly what Keith suggested in his last comment.
Linearize using the 21 step tool iteratively (twice) and then tune the final .quad with the Curve Adjustment tool.
PiezoDN is an intellectual departure from other negative printing systems in that all of the tools adjust the .quads for the final tones in the print: bringing the highlights up in the Curve Adjustment tool brings the highlights up in the final print. The negative (while it is the most integral part of the process) is barely thought about, it is a transitory object. Other systems focus much more on the densities of the negative and much less on their final effect on the print while PiezoDN is always focused on the final print densities: it’s a professional printmaker system.
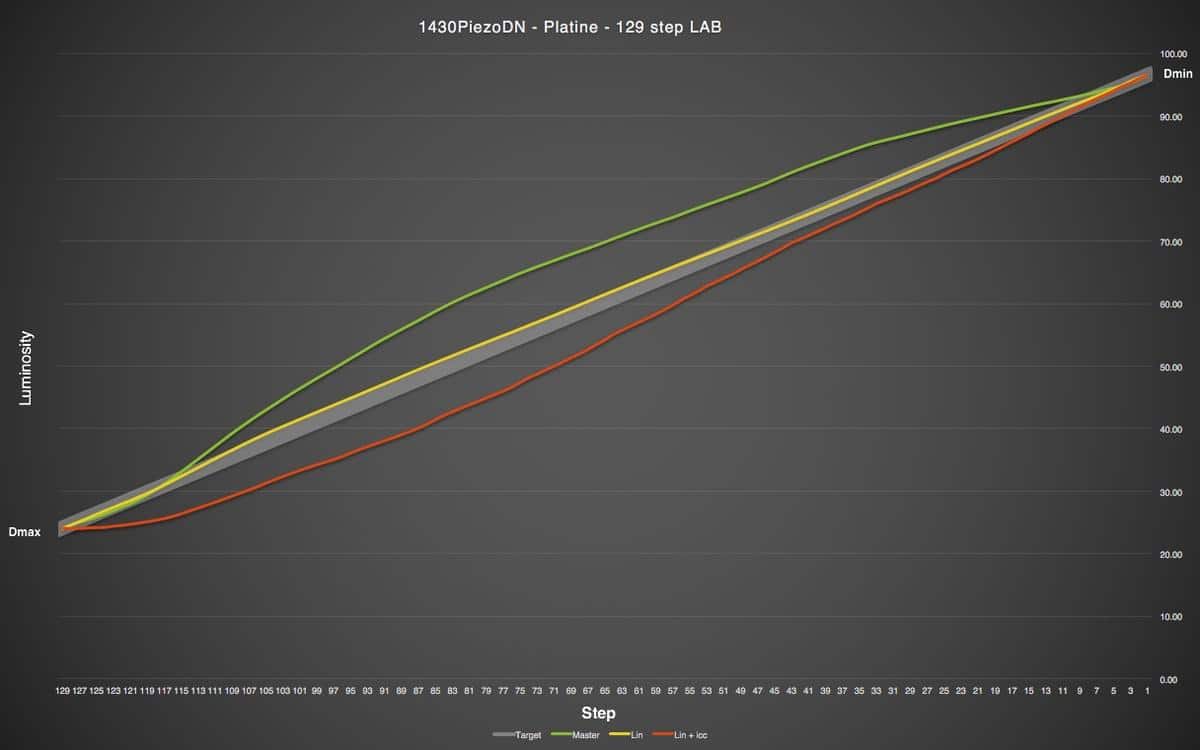
I’m sure Walker will have to answer your question, but I wonder if you might be able to clarify something. You said above that your goal was to bring the highlights down a bit, but then a couple sentences further you said “the highlights are darker rather than lighter.” That sounds to me like you achieved your goal; down means darker. On the graph in the attached file, which is plotting L* rather than density or percent, it appears that from 5 on up all the values are lighter than the linear target values.
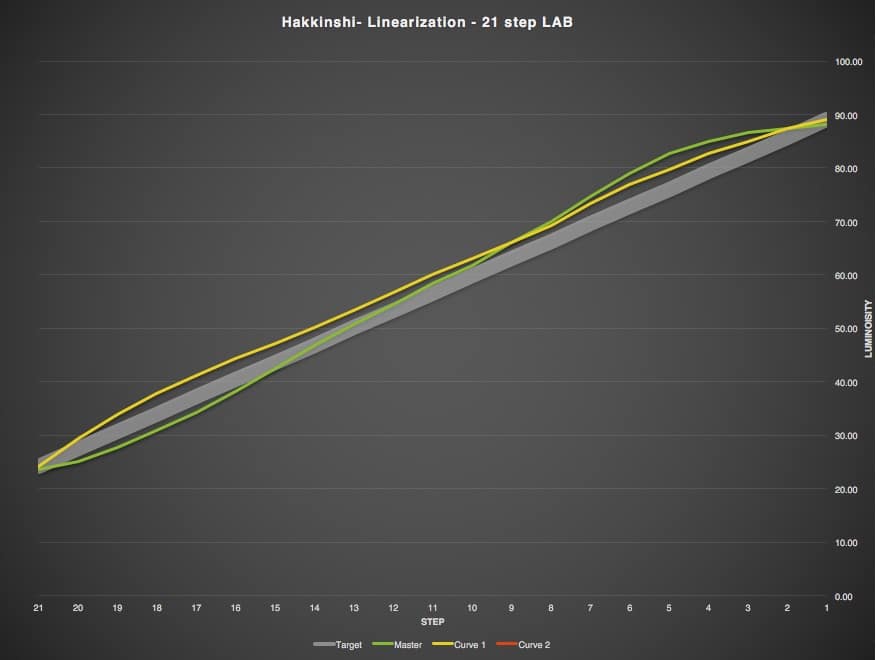
A quick graph showing your original print results and the adjusted results together would also be helpful. It might look something like the attached screenshot.
Thank you Keith for your helpful comments and graph. I realise there was some ambiguity in what I described. I wanted to make the highlights in the final print lighter i.e. bring down or reduce their density. I expected the measured values which showed the density of the highlights above their target would have adjusted the curve using the CGAT values attached to make the highlights lighter, but instead the highlights in the print became darker not lighter. When it was clear things hadn’t worked out I stopped measuring so can’t produce a graph of the results unfortunately. I expect Walker will say there’s confusion on my part and/or operator error! best wishes Julian
Julian - My suggestion then, is to do the 21-step Scanner linearization step twice, then if you still think you need to make a further adjustment, use the Curve Adjustment tool to tweak it where you think it need it. Good luck.