Walker,
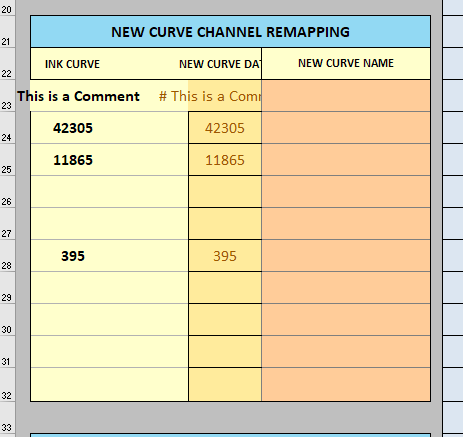
Doing my first calibration with PPEV2. It appears PPE doesn’t deal with valid comment lines in the “Starting Curve” quad file. Here are two screen shots showing corruption which appears in the Curve Remapping section:
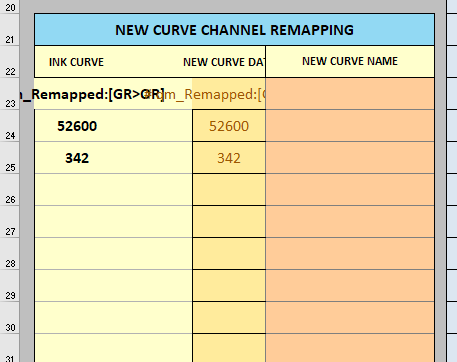
In the first case, there are two comment lines, each starting with “#” as allowed in valid quad files. In the second case, there is a single comment line, again starting with “#”. (I have to laugh because in this case, it is the comment line “# qm_Remapped:[GR>OR]” which I use to keep track of quad files that I have remapped with my own tools, and here it is showing up in your “New Curve Channel Remapping” tool )
Anyway, Roy says that any line in a quad file that starts with “#” (except of course the first header line) is a comment and can appear anywhere in the file.
Please let me know if it works. (right now it strips comments on the final .quad but it doesn’t mess up if comments exist in either the starting or blending curves). retention of comments + possible custom comments will come in 2.0.7
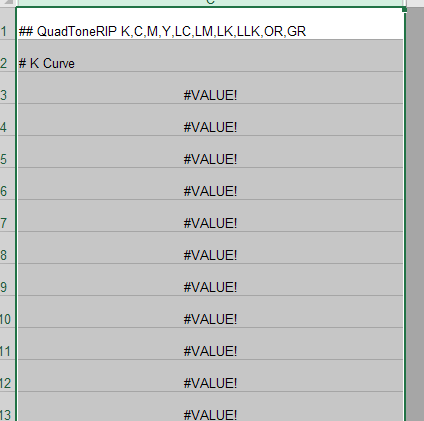
Still some problems on this test version. After bringing in the Measurements and then the Starting Curve (with comment line), I don’t see my individual curves in the graph. Also when I look at the NEW CURVE data I see this:
I am snowed in so not at my windows machine today.
The way to ensure that you are copy/pasting just text content is to open the original curve in a text editor and the select-all / copy. Then hit the A1 cell and paste. I assume you have done this but I wanted to re-iterate for those who are reading along.
Also putting odd chars in the comment line “:” and “[]” is not recommended no-matter the application used. Traditionally periods, underscores, dashes, and copyright tags have worked.
Also, did you download the 2.0.6 and open in excel 2016 windows and it did not work without changing a thing? If it did not work without changing a thing than there is something wrong, but if you opened it up and it worked than it’s detecting the comment correctly.
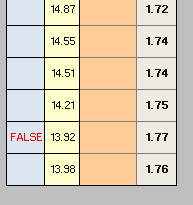
For this sequence of measurements, it seems that the LAST value (i.e. 13.98) should be the one marked as a False, i.e. it is the first one that is NOT in the proper sequence. But maybe I’m not understanding the logic behind how the Falses are marked. In this case which one of the numbers would you modify? (What I actually did: I modified the last one to 13.91).
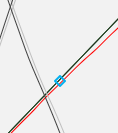
What does the small blue box indicate on the graph? I don’t see it documented anywhere, but I sometimes I see the boxes drop to the bottom of the graph and then back to the target linear line as I make smoothing adjustments.
sometimes the error isn’t the one below. In this case it is if you look at it as a human being who knows ink. For example if there were a lot more numbers below the 13.98 that weren’t falsed the 13.92 would most likely be the odd man out in relation to everything above and below. But it lakes a human eye to determine that.
As talked about in the demos, the falses logic gives you a general idea that there will be some false near or on the row the false is showing. It’s a little more complicated than that and might be worth it to do a bit more stringent logic as well but this gets oddly complicated and almost needs AI.
In this case the 13.92 is the MIN number so this is the best dMax and most likely the last patch is over-inking. The method for correction is as follows.
Correct the last patch to something below 13.92 (say 13.91), then set the shadow start point to 1. This cuts off the last over-inked bit.
This is the contrast tweak inputs/outputs. You can thing of them exactly as the points on a photoshop curve. In fact, if you make a 5 point curve in photoshop and copy/paste the input/outputs into the tweak controls you will see the exact same curve appear.
These tweaks can be capy/saved and copy/pasted as a whole row of input values or output values.
Just noticed that 2.0.7 is out there on the mac but not for Windows yet. Web site says “arriving on Nov. 14” (yesterday) for Windows. Is there an issue still on the Windows platform?